
Figure 10.
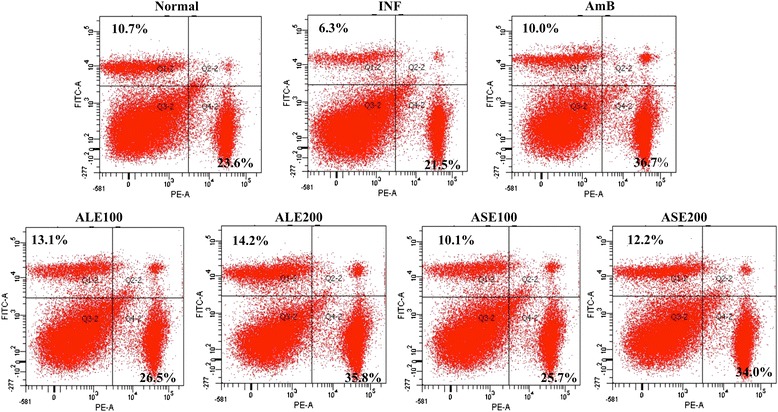
CD4 + and CD8 + upregulation induced by bioactive fractions. Splenic T lymphocytes from different treatment groups were co-stained with PE-conjugated antimouse-CD4 and FITC conjugated antimouse-CD8 antibodies. Results are expressed as dot plots and are representative of one of the two independent experiments performed. Inset shows percentages of CD4+ T cells (lower right) and CD8+ T cells (upper left) in respective quadrants.