
Figure 3.
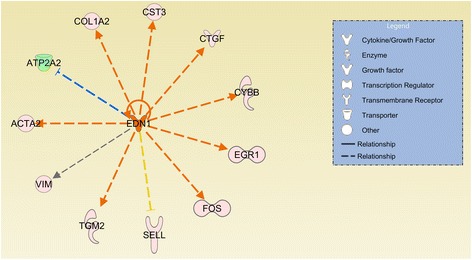
The differentially expressed gene network of the inferred upstream regulator EDN1 . Genes presented in orange are related to genes up-regulated in the LRFI phenotype group. Genes presented in blue are related to genes down-regulated in LRFI animals. The intensity of the colors is related to fold change estimates. Arrows presented in orange, gray and yellow indicate activation, effect not predicted and inconsistency, respectively.