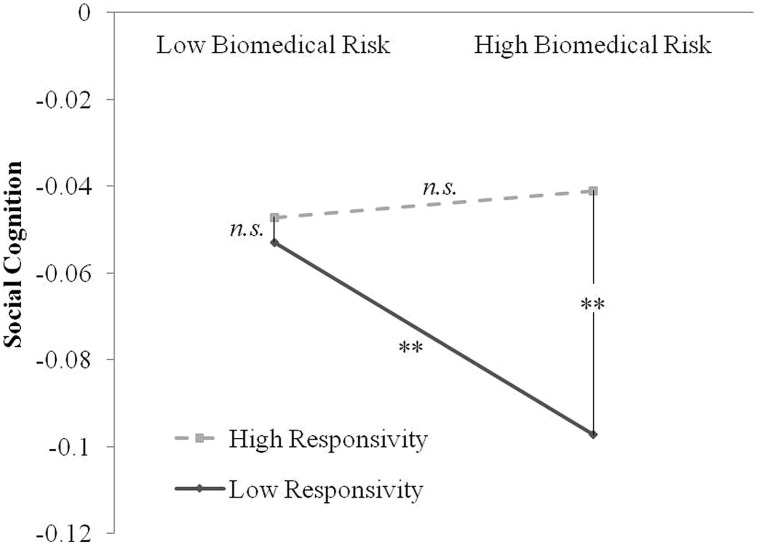
FIGURE 1.
Plotted interaction between cumulative biomedical risk by responsive parenting on social cognition at 18 months. Solid line represents low levels of maternal responsivity (-1 SD below the mean), and hashed line represents high levels of maternal responsivity (+1 SD above the mean). Each point on the plot represents a combination of high/low biomedical risk and high/low responsivity, for a total of four possible combinations. ∗∗denotes that that comparison between points is significant, where n.s. denotes that there is no difference between the points on social cognition.

