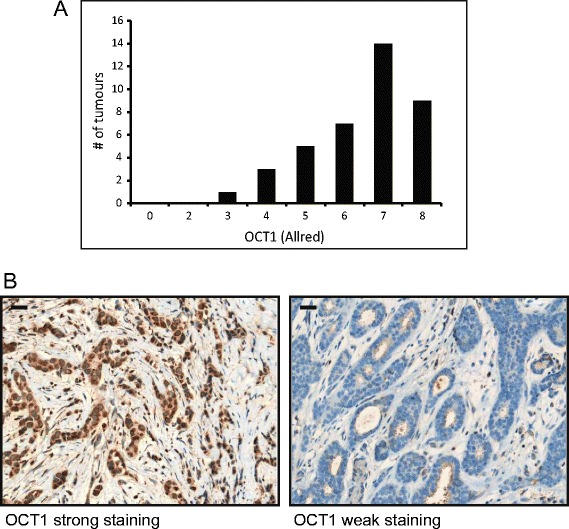
Figure 4.

Organic cation transporter 1 expression in breast tumors. Allred scores for organic cation transporter 1 (OCT1) as measured in the surgical tumor specimen (post-metformin). (A) Graph depicting distribution of OCT1 Allred scores. (B) Immunohistochemical staining of tumor tissue for OCT1. Representative images are shown for strong (Allred 8) and weak (Allred 3) staining. Scale bar represents 30 μm.
