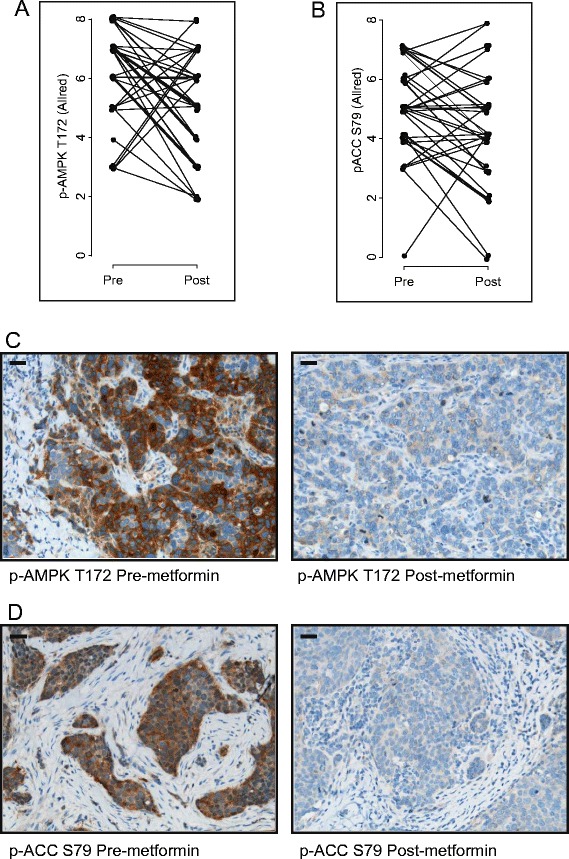
Figure 5.

Changes in phosphorylated AMP-activated protein kinase and phosphorylated acetyl coenzyme A carboxylase levels upon metformin treatment. Allred scores for (A) phosphorylated AMP-activated protein kinase (p-AMPK) T172 and (B) phosphorylated acetyl coenzyme A carboxylase (p-ACC) S79 as measured pre- and post-metformin treatment. Immunohistochemical staining of tumor tissue for (C) p-AMPK T172 and (D) p-ACC S79. Representative images are shown for each phospho-protein pre- and post-metformin treatment. Corresponding Allred scores were as follows: p-AMPK T172 pre-metformin = 8, post-metformin = 4; p-ACC S79 pre-metformin = 7, post-metformin = 4. Scale bar represents 30 μm.
