
Figure 2.
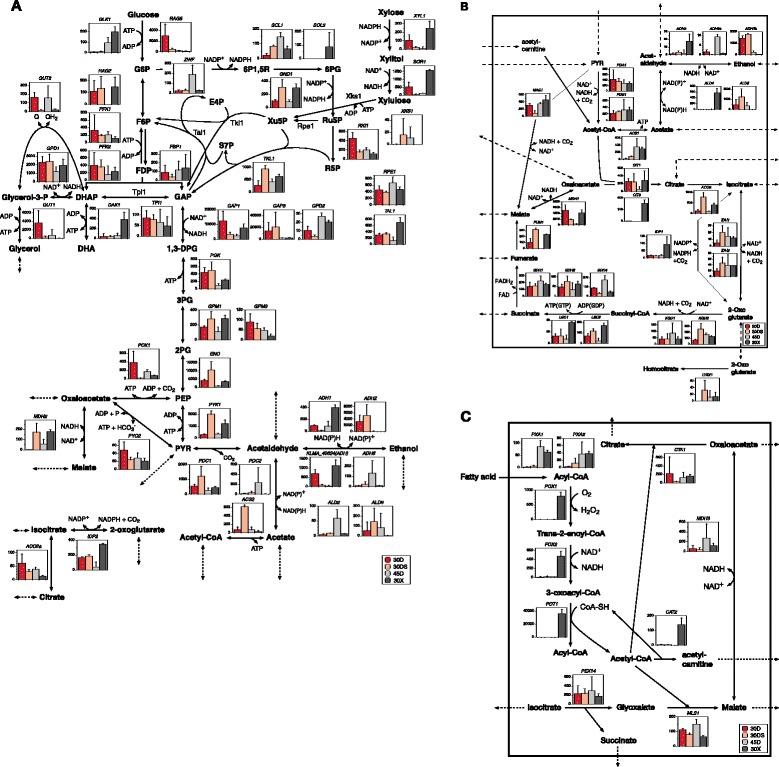
Transcript abundance of genes related to central metabolic pathways under different conditions in K. marxianus. The transcript abundance was determined by TSS analysis. The Y axis of each column graph shows the transcript abundance of each gene as TSS-tag ppm. Columns from left to right in each graph represent 30D (strong red), 30DS (soft orange), 45D (gray), and 30X (dark gray). Empty columns mean gene expression below the detectable level. (A) Central metabolic pathway. (B) Mitochondrial metabolic pathway. (C) Peroxisomal metabolic pathway. Abbreviations are as follows: G6P, glucose-6-phosphate; F6P, fructose-6-phosphate; FDP, fructose 1,6 bisphosphate; DHAP, dihydroxyacetone phosphate; DHA, dihydroxyacetone; GAP, glyceraldehyde-3-phosphate; 1,3-DPG, 1,3-bisphosphoglycerate; 3PG, 3-phosphoglycerate; 2PG, 2-phosphoglycerate; PEP, phosphoenolpyruvate; PYR, pyruvate; 6P1,5R, 6-phospho-D-glucono-1,5-lactone; 6PG, 6-phosphogluconate; Ru5P, ribulose-5-phosphate; R5P, ribose-5-phosphate; Xul5P, xylulose-5-phosphate; E4P, erythrose-4-phosphate; S7P, sedoheptulose-7-phosphate; NAD, nicotinamide adenine dinucleotide; NADP, nicotinamide adenine dinucleotide phosphate; Q, quinone; ATP, adenosine triphosphate; ADP, adenosine diphosphate.