
Figure 3.
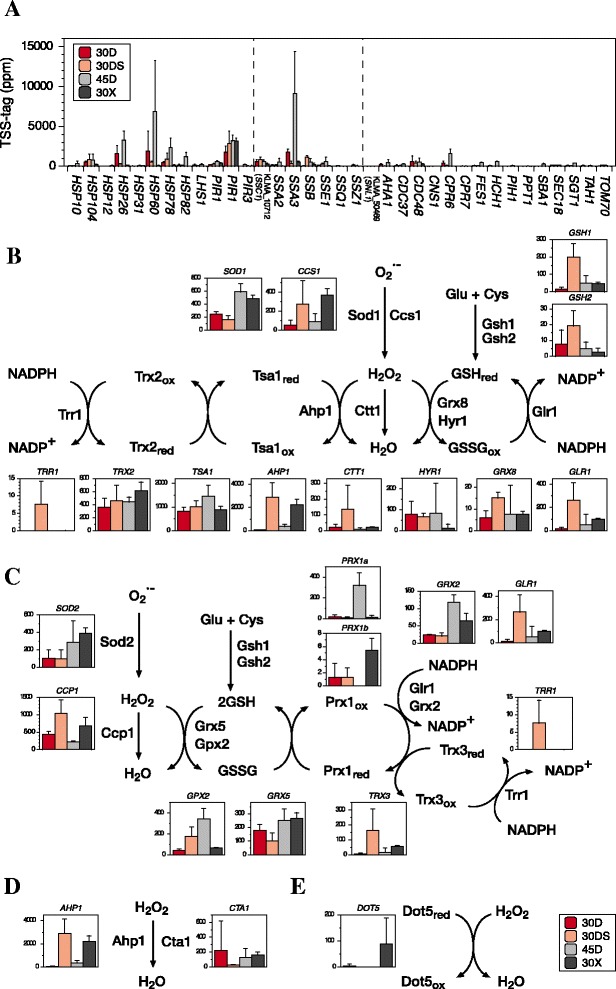
Transcript abundance of genes related to oxidative stress response in K. marxianus . (A) Transcript abundance of heat shock genes and related genes listed in Additional file 1: Table S18 is represented as TSS-tag ppm. Enzyme reactions to scavenge ROS in (B) cytoplasm, (C) mitochondria, (D) peroxisome, and (E) nucleus are shown. Each column in the graph shows the transcript abundance of each gene as described in Figure 2.