
Figure 2.
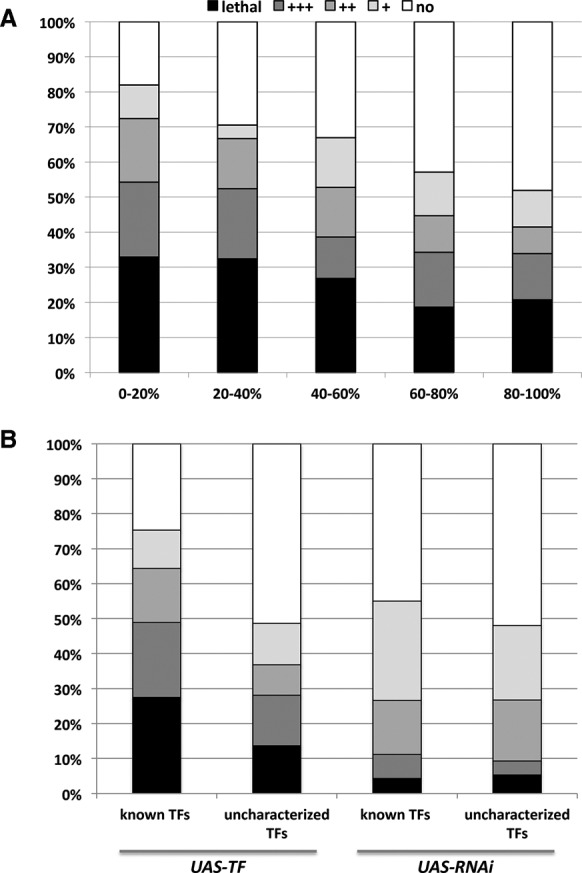
Characteristics of phenotype-inducing TFs. (A) The misexpression phenotype distributions of TFs belonging to specific RNA Pol II occupancy bins (from the lowest to the highest 20% RNA Pol II occupancy) are compared. RNA Pol II DNA occupancy was used here as a proxy for the extent of TF expression. Grayscaling of the bars applies also to panel B. (B) Effects of overexpression are compared to those of RNAi-mediated knockdown. UAS-TF and UAS-RNAi were grouped into known genes with annotated names and uncharacterized genes that are only annotated by a CG number.