
Figure 4.
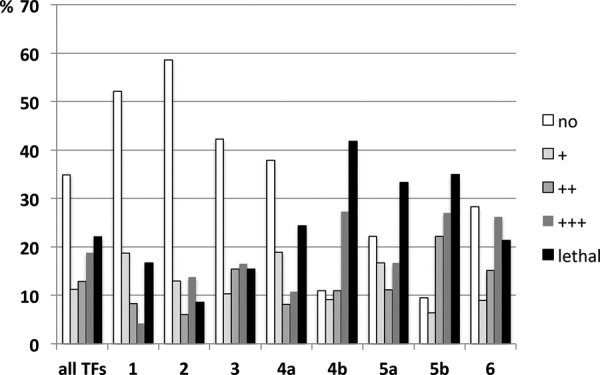
Distribution of phenotypes induced by TFs in the different clusters. The chart illustrates the distribution of phenotypes caused by misexpression of all TFs and from each cluster (c1–c6, x-axis) by MS1096-Gal4 in the wing.
Official websites use .gov
A
.gov website belongs to an official
government organization in the United States.
Secure .gov websites use HTTPS
A lock (
) or https:// means you've safely
connected to the .gov website. Share sensitive
information only on official, secure websites.
Distribution of phenotypes induced by TFs in the different clusters. The chart illustrates the distribution of phenotypes caused by misexpression of all TFs and from each cluster (c1–c6, x-axis) by MS1096-Gal4 in the wing.