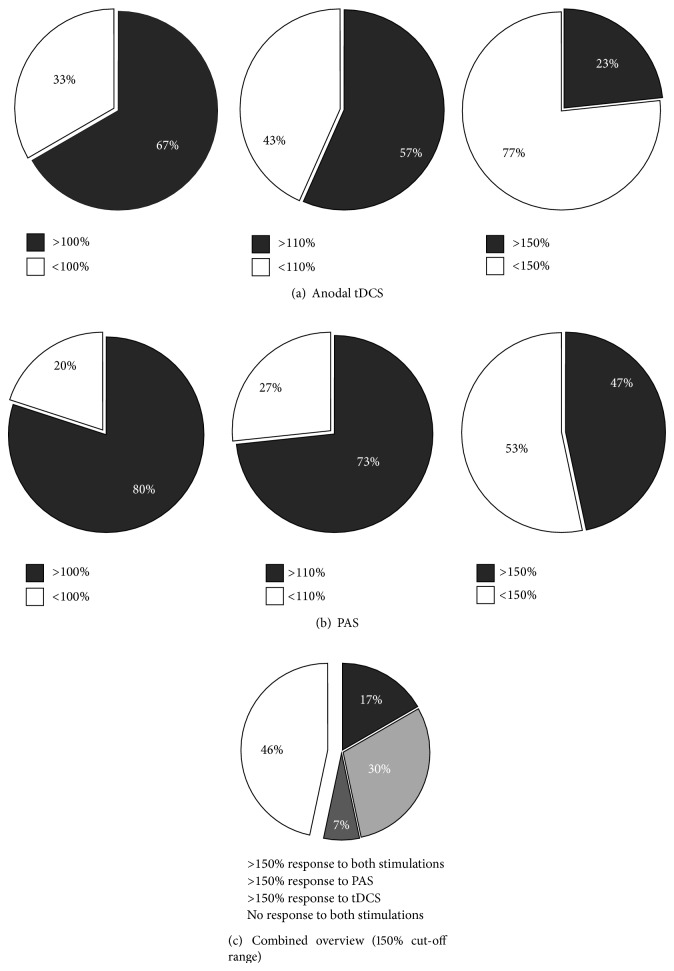
Figure 3.
Individual response patterns of all subjects for (a) anodal tDCS and (b) PAS separated according to the defined cut-off ranges of >100%, >110%, and >150% relative to baseline MEP values (set as 100%). Responders (R) are depicted with grey coloured fields and nonresponders (NR) with white fields. (c) Grouped presentation of responders to both stimulation types (17%, dark grey), to PAS only (33%, light grey), or to anodal tDCS only (7%, intermediate grey) and nonresponders (46%, white) for the >150% cut-off range relative to baseline MEP values (set as 100%).

