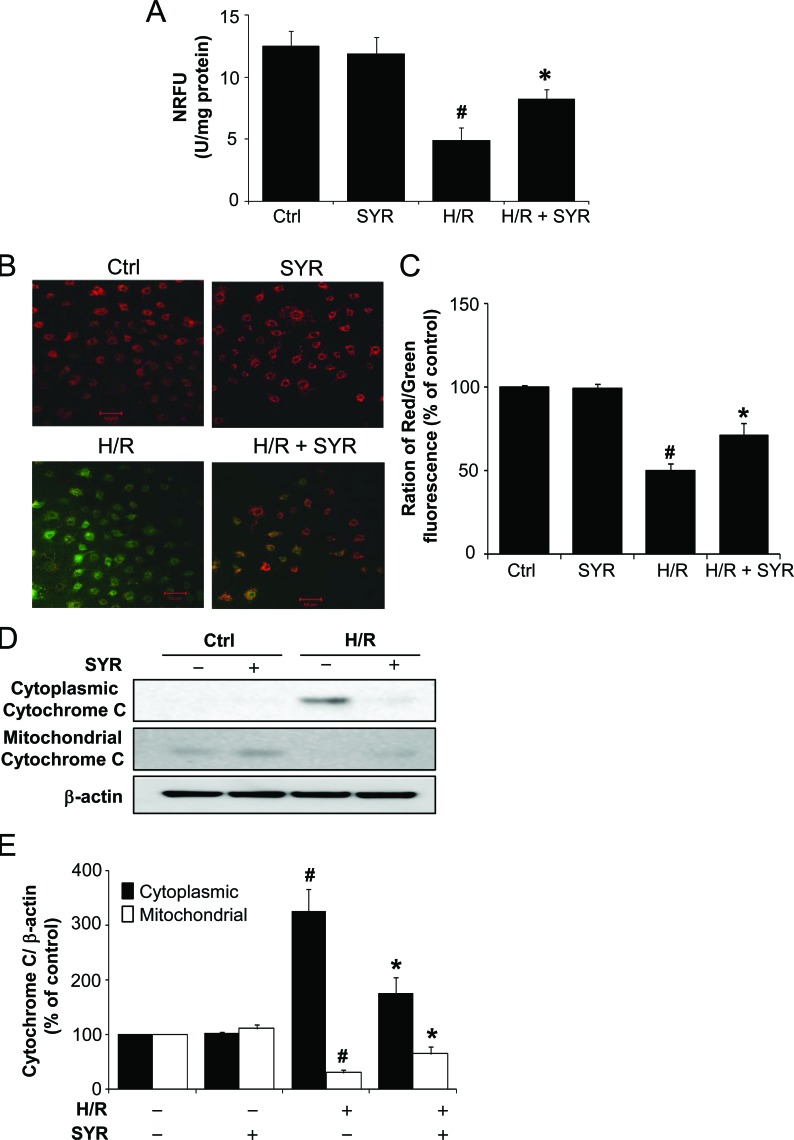
Figure 4. Syringaresinol prevents mitochondrial dysfunction induced by H/R.
(A) The influence of syringaresinol on the opening of mPTP in H9c2 exposed to H/R was assayed using the calcein-cobalt quenching method. The NRFU of calcein measurements were compared among different treatment groups of H9c2. (B) The effects of syringaresinol on H/R-induced dissipation of mitochondrial membrane potential (ΔΨm) were determined by JC-1 staining. Red fluorescence is from JC-1 aggregates in healthy mitochondria with polarized inner membranes, while green fluorescence is emitted by cytosolic JC-1 monomers and indicates ΔΨm dissipation. Scale bar: 50 μm. (C) A bar graph showing the ratio of red to green intensity indicates the changes in ΔΨm. (D) Levels of cytochrom c in the mitochondrial and cytosolic fraction were determined using Western blot analysis. (E) Quantification of cytochrome c levels over actin. All results are representative or means ± SD of six independent experiments. #P < 0.001 versus control group, *P < 0.001 versus H/R treatment group. NRFU: normalized relative fluorescence units. Ctrl:control; H/R: hypoxia/reoxygenation; SYR: syringaresinol.

