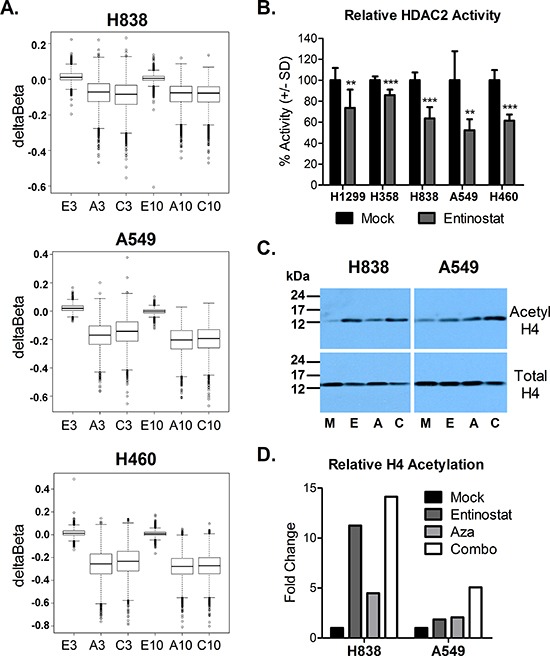
Figure 1. Epigenetic changes associated with azacitidine and entinostat treatment.

(A) Box plots of deltaBeta values depicting promoter region (+/− 1500 bp of transcription start site) demethylation (negative deltaBeta) relative to mock control (probes with Beta >0.5) at day 3 and day 10 following treatment with entinostat (E), Aza (A), or combo (C). (B) Percent HDAC2 enzyme activity after 24 h treatment with 50 nM entinostat, relative to mock control. Bars represent the mean of seven replicates +/− standard deviation. Statistical significance by two-tailed, unpaired t-test denoted as follows: **p < 0.01, ***p < 0.001. (C) Western blots depicting acetylated histone H4 (lysine 5, 8, 12, 16) and total histone H4 levels at the end of treatment (day 3) with mock (M), entinostat (E), Aza (A), or combo (C). (D) Quantified histone H4 acetylation, relative to mock control.
