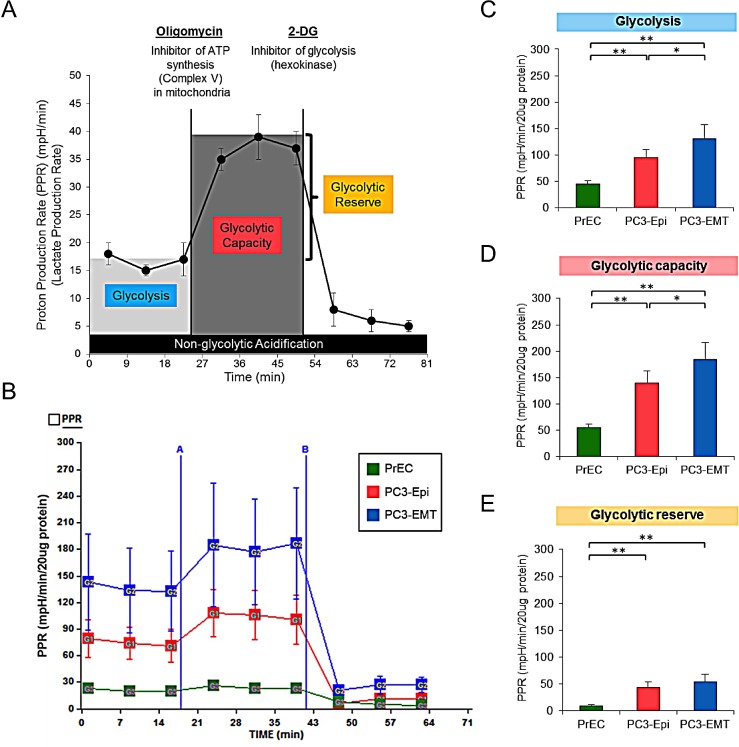
Figure 2. PC3-EMT cells have higher glycolytic activity compared to PC3-Epi cells.
(A) Example of proton production rate (PPR) analyzed by a Seahorse Bioscience XF24 Extracellular Flux Analyzer when oligomycin and 2-deoxy-D-glucose (2-DG) were injected. Glycolysis, glycolytic capacity and glycolytic reserve were calculated as shown in the image. (B) Representative traces of PPR in PC3-Epi, PC3-EMT and PrECs. PPR was measured continuously throughout the experimental period at baseline followed by the addition of the indicated drugs. A; oligomycin (1uM), B; 2-DG (100mM). Glycolysis (C), glycolytic capacity (D) and glycolytic reserve (E) were calculated from the mean of three baseline readings. The independent biological experiments were repeated at least three times. Data were represented as the mean ± SD from 6 or 7 Seahorse microplate wells. *P<0.05, **P<0.01.

