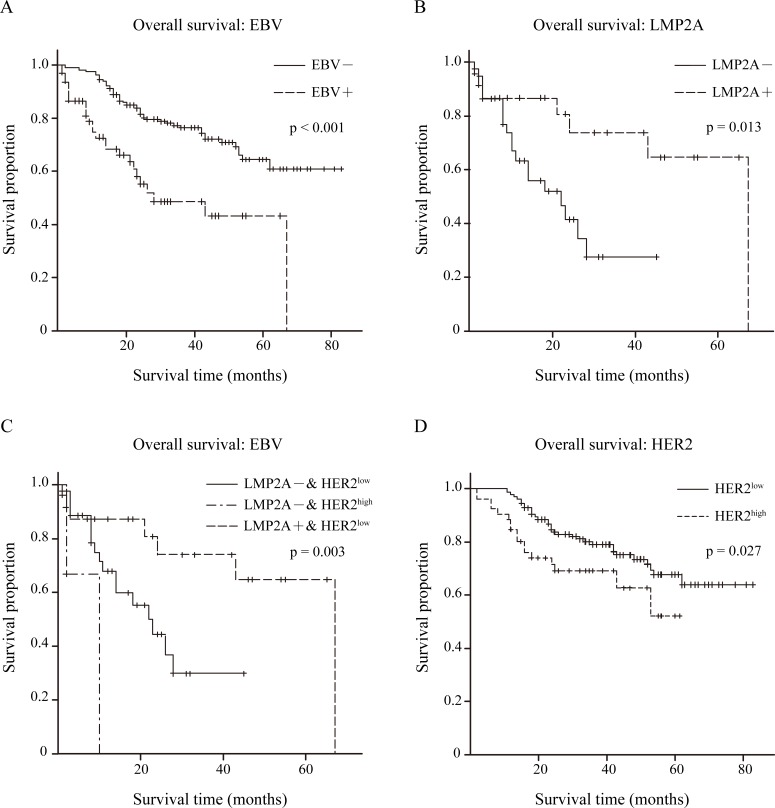
Figure 4. Overall survival condition within 279 GC patients.
(A) Kaplan-Meier curves for overall survival time in 279 GC patients according to EBV expression, p<0.001 by log-rank test. EBV– group n=216, EBV+ group n=63. (B) Kaplan-Meier curves for overall survival time in 63 EBVaGC patients according to LMP2A expression, p=0.013 by log-rank test. LMP2A– n=39, LMP2A+ n=24. (C) Kaplan-Meier curves for overall survival time in 63 EBVaGC patients based on both LMP2A and HER2 expression, p=0.003 by log-rank test. LMP2A– & HER2low (0/1+) n=36, LMP2A– & HER2high (2/3+) n=3, LMP2A+ & HER2low (0/1+) n=24. (D) Kaplan-Meier curves for overall survival time in 216 EBVnGC patients according to HER2 expression, p=0.027 by log-rank test. HER2low (0/1+) n=165, HER2high (2/3+) n=51.

