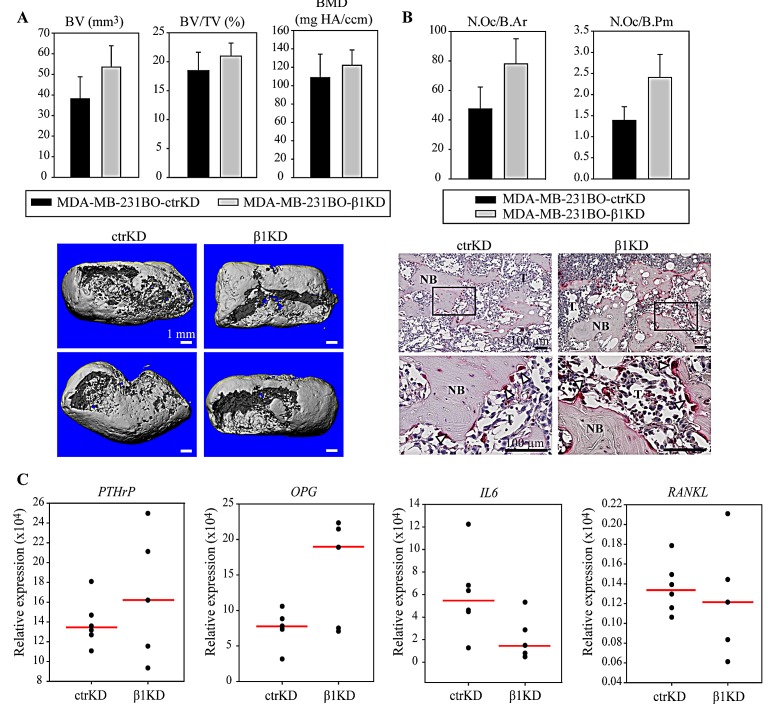
Figure 5. β1 integrins do not influence BC-induced bone resorption and osteoclast activation in vivo.
A: Representative 3D reconstructions of μ-CT data and quantification of BV, BV/TV and BMD. B: Histomorphometric analysis of osteoclast density normalized to the mineralized tissue area (N.Oc/B.Ar) or perimeter (N.Oc/B.Pm) and representative images of TRAP staining at low and high magnification. C: qRT-PCR analysis of PTHrP, OPG, IL-6 and RANKL gene expression in tumors formed in hTEBCs. Data in bar charts are represented as mean ± standard error. Dot plots represent individual data points and median. NB: new bone, T: tumor.

