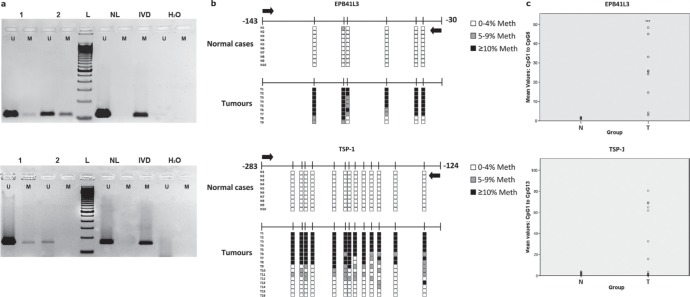
Figure 1.
(a) Methylation-specific PCR (MSP) of EPB41L3 (upper) and TSP-1 (lower) genes. In the case of EPB41L3, cases 1 and 2 are less and more methylated, respectively; for TSP-1, case 1 is methylated and case 2 is unmethylated (U: unmethylated; M: methylated; NL: negative control; IVD: in vitro-methylated DNA). (b) Pyrosequencing results of EPB41L3 (upper) and TSP-1 (lower) analysis in normal (N) and tumoral (T) cases. The diagram shows the percentage methylation of the CpG positions (vertical lines) in each normal and tumoral case, represented by squares. Black arrows represent the location of the MSP primers. (c) Mean DNA methylation values of EPB41L3 (upper) and TSP-1 (lower) in normal (N) and tumoral (T) cases.

