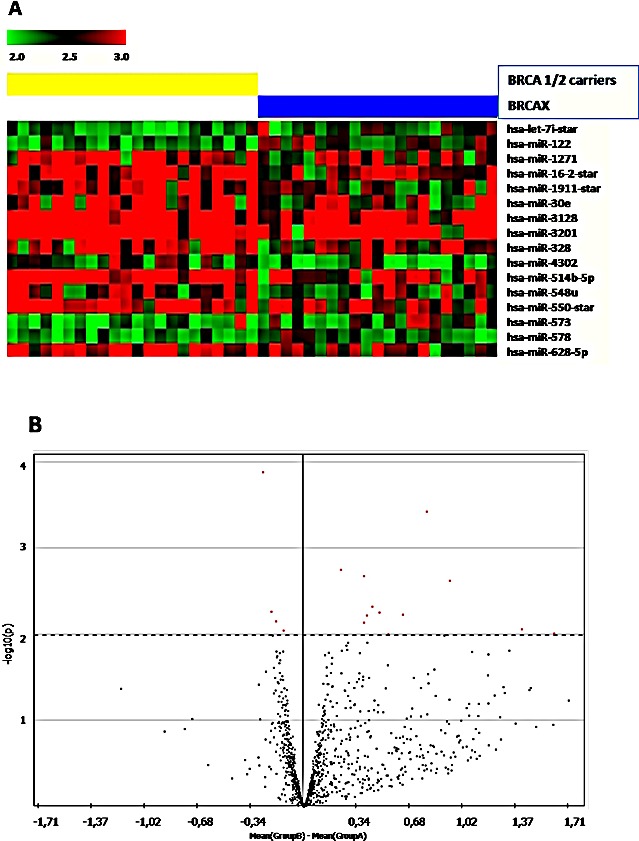
Figure 1.

(A) Heatmap showing miRNAs significantly (p<0.001) deregulated in BRCA1/2-related breast (left) tumors and BRCAX (right). Red dots represent up-regulated and green down-regulated miRNAs. (B) Volcano plot, an intuitive way to visualize differences in mean fluorescence in relation to p-value. Significant miRNAs are located above the dotted line, which indicate −log10[cut-off p-value < 0.01 considered in the statistical analysis. Left side: miRNAs which are down-regulated in BRCA1/2 mutation carriers; right side: up-regulated miRNAs in BRCA1/2 mutation carriers.
