
Figure 4. Tumor suppression functions of miR-125a-5p in vivo.
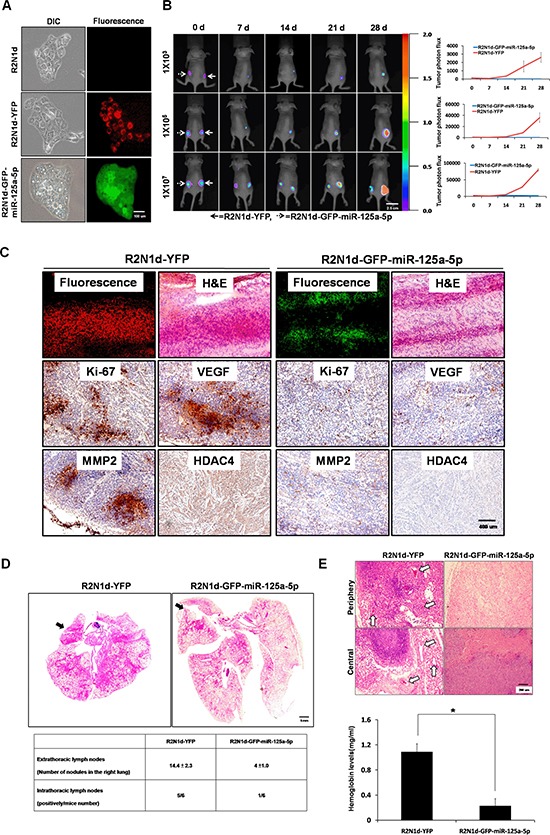
(A) R2N1d cells were infected with a YFP or GFP-miR-125a-5p plasmid, and the stable clones R2N1d-YFP and R2N1d-GFP-miR-125a-5p were obtained. GFP and YFP were detected with immunofluorescence, scale bar = 100 um. (B) R2N1d-YFP (solid arrows) and R2N1d-GFP-miR-125a-5p (dotted arrows) cells were injected into the right and left sides of immunodeficient SCID mice (n = 6 per group), respectively. The number of cells injected is shown to the left of each row. Left, bioluminescence imaging of the whole body of the mice was performed 0, 7, 14, 21, and 28 d after transplantation. Right, the mean fluorescence intensity was quantitated using MetaMorph software, scale bar = 2.5 cm. (C) The solid tumors derived from the nude mice were cut at a thickness of 5 μm. Fluorescence expression was analyzed with immunofluorescence, and H&E staining, and immunohistochemistry for Ki-67, VEGF, MMP2, and HDAC4 staining were performed, scale bar = 400 um. (D) R2N1d-YFP or R2N1d-GFP-miR-125a-5p cells were mixed with Matrigel and injected into the left lateral thorax of mice. Top, H&E staining of sections of the left and right lungs 7d after transplantation. Bottom, the extra- and intra-thoracic lymph nodes in the right lung were quantified with a dissecting microscope and pathologically confirmed by H&E staining. The arrow indicates the location of the injection, scale bar = 5 mm. (E) The cell were injected as in (B). Blood vessel formation was observed with H&E staining (top), and hemoglobin values were analyzed using Drabkin's reagent kit (bottom). The arrows show the location of the blood vessels, scale bar = 200 um.