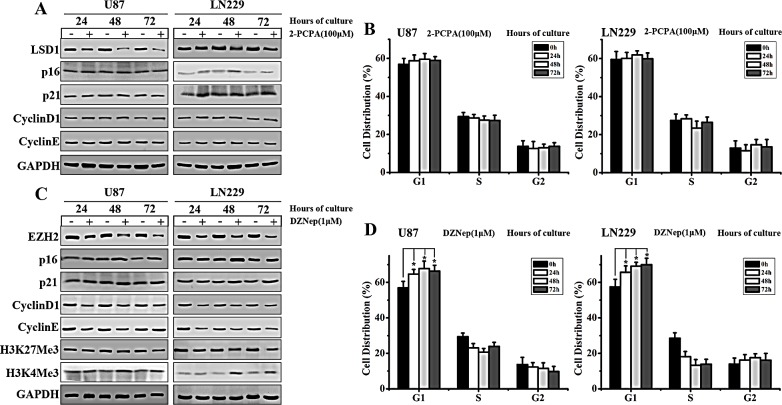
Figure 1. EZH2 inhibition blocks cell cycle progression in GBM cells.
(A) Western blot analysis of U87 and LN229 cells shows the expression of LSD1, p16, p21, Cyclin D1 and Cyclin E after treatment with 2-PCPA (100 μM) at 24, 48 and 72 h, with GAPDH serving as a loading control. (B) Flow cytometry was performed to examine the G1/S arrest effect in U87 and LN229 cells after treatment with 2-PCPA (100 μM) for 24, 48 and 72 h. (C) Western blot analysis shows the expression of EZH2, p16, p21, Cyclin D1, Cyclin E, H3K27Me3 and H3K4Me3 in U87 and LN229 cells treated with DZNep (1 μM) at 24, 48 and 72 h, with GAPDH as a loading control. (D) Flow cytometry was performed to examine the G1/S arrest effect in U87 and LN229 after treatment with DZNep (1 μM) for 24, 48 and 72 h. The results presented represent mean values ± SD of 3 independent experiments, which were each performed in triplicate. Student's paired t tests were used to calculate P values, where P < 0.05 was considered to be statistically significant.

