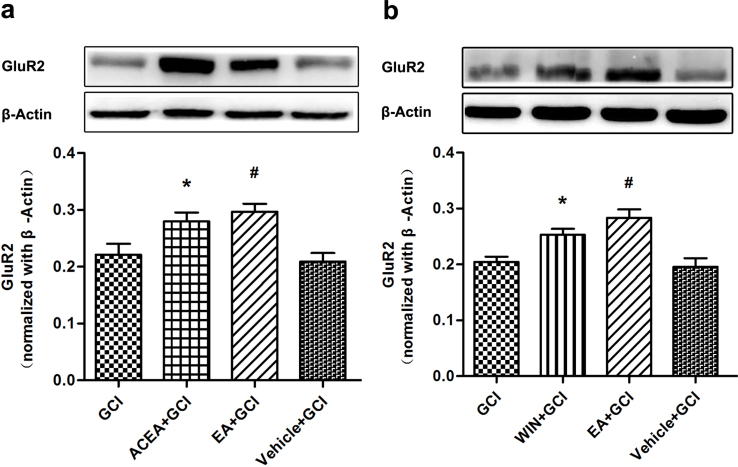
Figure 6. Pretreatment with CB1R agonists up-regulated GluR2 expression (n = 5).
(a, b) Western blot analysis of GluR2 expression in GCI, ACEA+GCI, WIN55212-2+GCI, EA+GCI and Vehicle+GCI group. The upper part is the photograph of GluR2 and its corresponding β-Actin bands. (*P < 0.05 vs. GCI; #P < 0.05 vs. GCI).

