Figure 5.
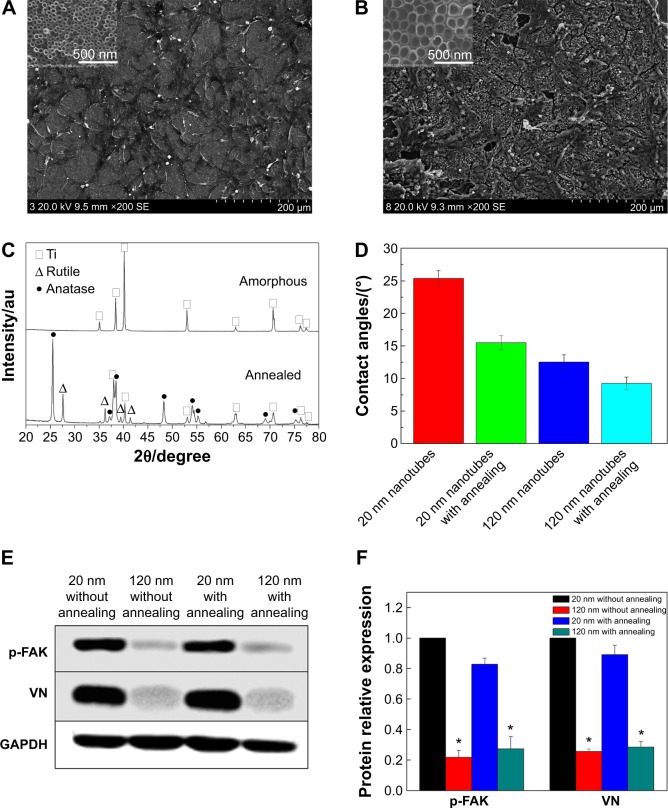
Cell morphology, crystallinity, and contact angle of the TiO2 nanotubes.
Notes: (A) Scanning electron micrographs of U87 glioma cells on the 20 nm nanotubes with annealing at 450°C. (B) Scanning electron micrographs of U87 cells on the 120 nm nanotubes with annealing at 450°C. (C) X-ray diffraction patterns for amorphous nanotubes and annealed nanotubes. (D) Contact angles of amorphous nanotubes and annealed nanotubes. (E) Expression levels of vitronectin and p-FAK in U87 glioma cells cultured on 20 nm and 120 nm nanotubes with or without annealing. (F) Statistical analysis of vitronectin and p-FAK expression. The densities of vitronectin and p-FAK bands were measured, and the ratio was calculated. *P<0.05, compared with the 20 nm nanotubes.
Abbreviations: au, absorbance units; p-FAK, phosphor-focal adhesion kinase; VN, vitronectin; GAPDH, glyceraldehyde-3-phosphate dehydrogenase; Ti, titanium.

