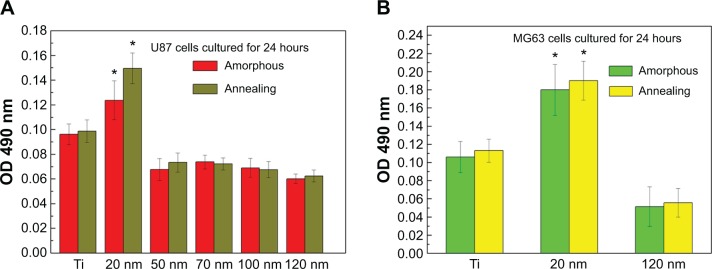
Figure 6.

Viability of U87 (A) and MG-63 (B) cells on nanotubes with different diameters after cell culture for 24 hours. The data are presented as the mean ± standard deviation (n=3). *P<0.05 versus titanium, 50 nm, 70 nm, 100 nm, and 120 nm samples.
Abbreviations: Ti, titanium; OD, optical density.
