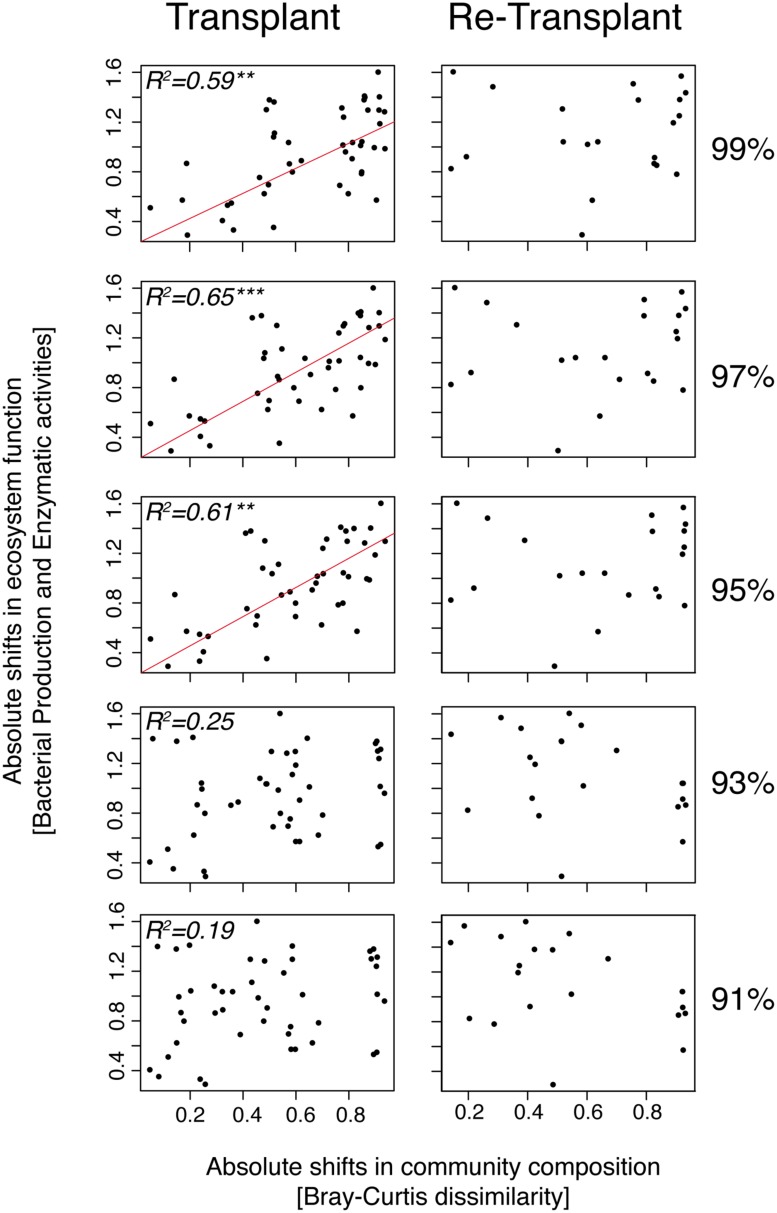
FIGURE 8.
MANTEL tests and plots of distance matrices of absolute shifts in community composition measured by Bray–Curtis distance estimation versus absolute shifts in bacterial community functioning (pooled bacterial production and enzyme activities) measured by Canberra distance estimation. Bray–Curtis dissimilarity matrices of community composition were performed at different cluster levels (99, 97, 95, 93, and 91%) of 16S rRNA gene identity. All microcosms are compared with each other. Red lines indicate significant correlations and R2 values above 0.5. Asterisks denote the significance levels; ∗∗p < 0.001, ∗∗∗p < 0.0001.

