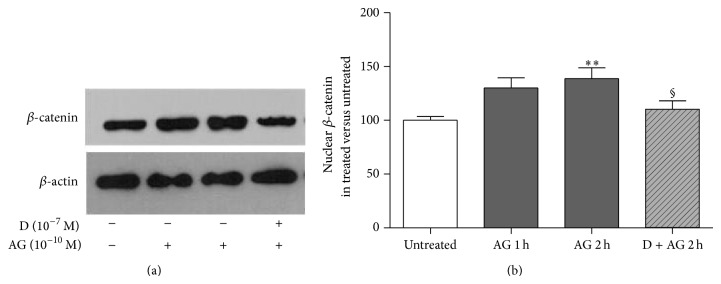
Figure 3.

Representative Western blot (a) and quantification (b) of β-catenin levels in the enriched nuclear fraction of rat osteoblast-like cells exposed to ghrelin (AG, 10−10 M for 1 and 2 h) alone or together with D-Lys3-GHRP-6 (D, 10−7 M 30 min before AG), a GHSR-1a receptor antagonist. β-catenin levels are normalized on β-actin protein levels and results are expressed as the ratio of β-catenin amount measured in treated cells to the amount obtained in untreated cells. Data are the mean ± SEM of five experiments ** P < 0.01 versus untreated; § P < 0.05 versus 2 h AG treated cells.
