Figure 2.

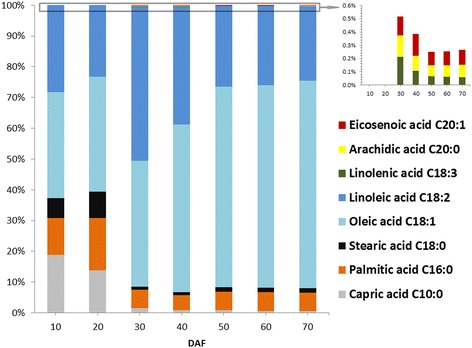
Changes in the fatty acid composition during SASK development. The data represent the mean of three independent measurements.

Changes in the fatty acid composition during SASK development. The data represent the mean of three independent measurements.