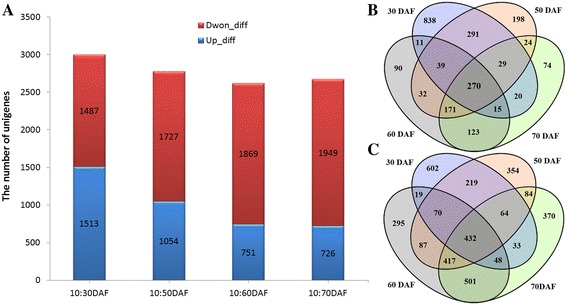
Figure 4.

Number and distribution of up-regulated and down-regulated genes. (A) The number of up-regulated or down-regulated unigenes during developing SASK. (B) The distribution of up-regulated genes in differently developmental periods. (C) The distribution of down-regulated genes in differently developmental periods. The detailed sequences were showed in Additional file 9: Table S4.
