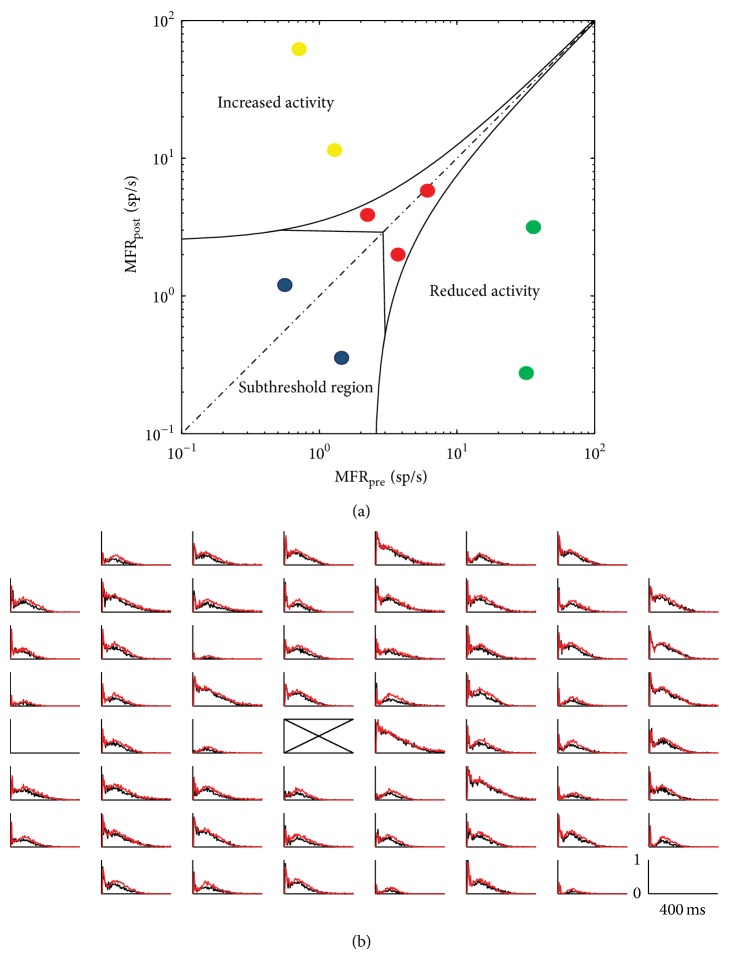
Figure 3.
Initial conditions necessary to induce plasticity in cortical cultures. (a) Bilogarithmic plot of the mean spontaneous firing rates of cortical neurons. Spontaneous activity of each network was measured at the beginning of the experiment (MFRpre) and after the first test stimulus session (MFRpost). Curved lines denote confidence intervals (see [20]). The used colors have the following meanings: red circles represent cultures that verify the MFR stability conditions and are potentially able to show plastic behavior. Blue circles indicate culture with a firing rate too low, while yellow and green circles represent unstable cultures which increase (yellow) or decrease (green) their firing rate. (b) PSTH map. This example shows the effects on the network during the stimulation from the site indicated by the cross. The two superimposed profiles of the PSTH represent the responses of the network to two different sessions of stimulation. Bin size = 4 ms; x-axis [0,400] ms; y-axis scale [0,1] is the probability to evoke spikes.

