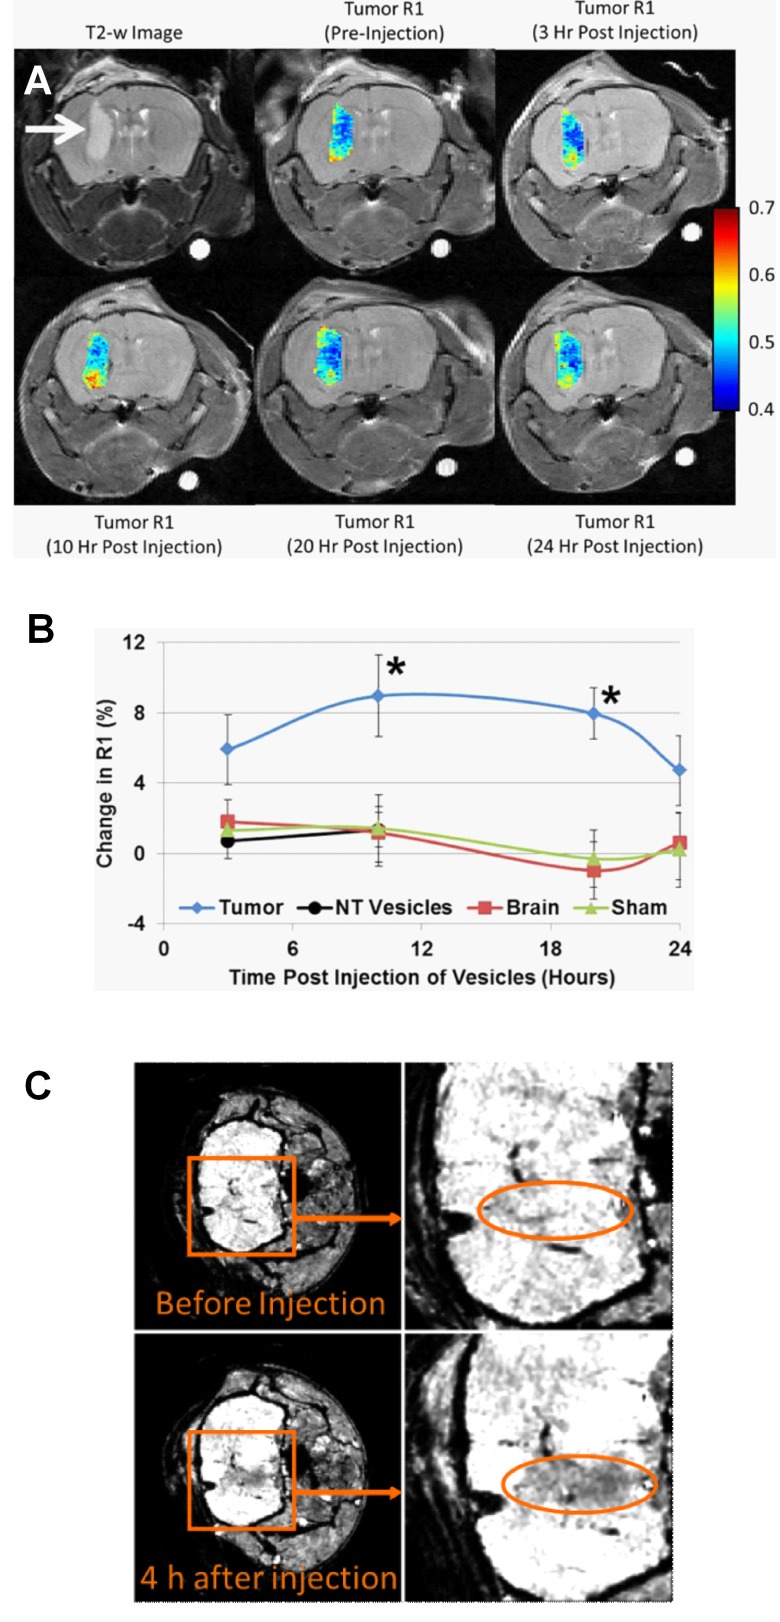
Figure 5. MRI of GBM with paramagnetic SapC-DOPS.
A) Changes in longitudinal relaxation rate (R1) in a mouse GBM after a single i.v. injection with Gd-DTPA-BSA/SapC-DOPS. A T2-weighted image (upper left) provides clear definition of the tumor (arrow). The color-coded R1 values show progressive increase with peak reached 10 h post injection. B) Percent change in R1 in the tumor, contralateral normal brain, and sham brain after injection of Gd-DTPA-BSA/SapC-DOPS nanovesicles, and R1 change in the tumor after injection of non-targeted (NT) vesicles (lacking SapC). At 10 and 20 h post-injection, the increase in R1 measured for Gd-DTPA-BSA/SapC-DOPS was significantly higher in the tumor (9.0% and 7.9%) compared with the normal brain, sham brain, or the tumor signal from non-targeted vesicles (<1.4%; *p<0.05). C) High-resolution MRI (7T) of a glioma in a nude mouse in vivo after a single i.v. injection with SapC-DOPS-USPIO. Negative contrast enhancement is observed in T2*-weighted images, 4 hours after i.v. injection of SapC-DOPS-USPIO (250 μl containing ∼22 μg iron).

