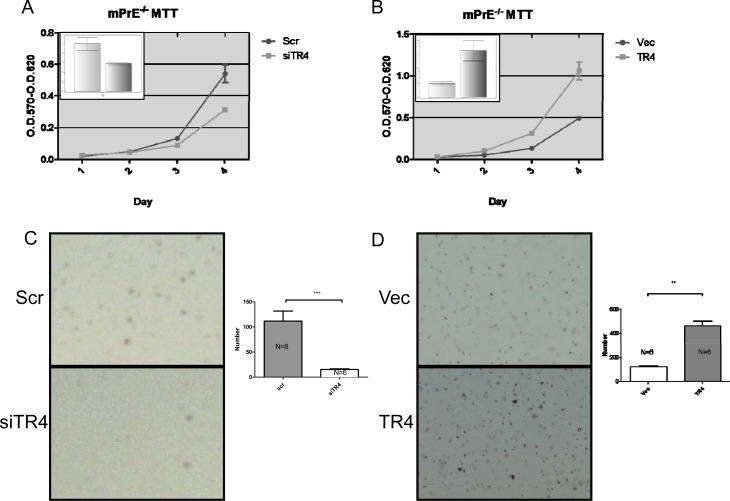
Figure 2. TR4 increases PPARG null normal prostate epithelial cell growth and transformation.
(A-B) Cell growth was assayed by MTT in the PPARG null normal prostate epithelial cell line mPrE−/−. TR4 knockdown (siTR4) compared to scramble control (Scr) shown in (A) and TR4 over-expressed (TR4) compared to vector control (Vec) shown in (B). The inset graphs represent the TR4 mRNA level by QPCR. (C-D) Anchorage independent cell growth was assayed by agarose colony formation. TR4 knockdown compared to scramble control shown in (C) and TR4 over-expressed compared to vector control shown in (D). Right panels show the quantification of the colony numbers. **P<0.01, ***P< 0.001

