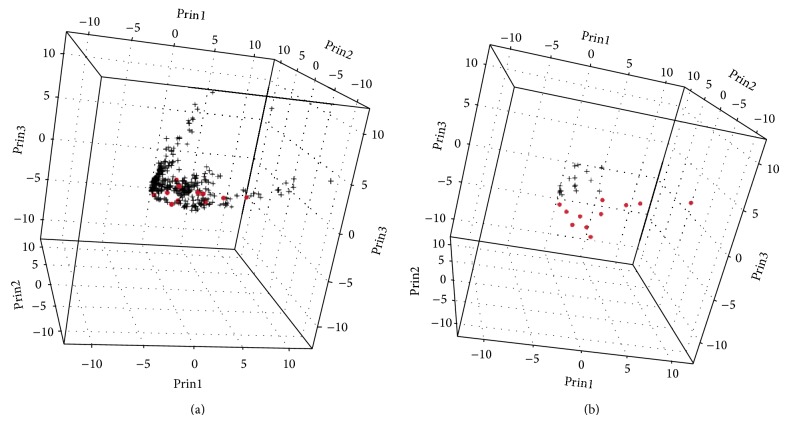
Figure 1.
Principal components analysis of individual samples grouped by “pregnant” (+) versus “nonpregnant” (•). In (a, left), all samples are plotted with no clear separation of the groups. When only the baseline first trimester samples are plotted against the nonpregnant controls (b, right), a separation between the groups becomes apparent.

