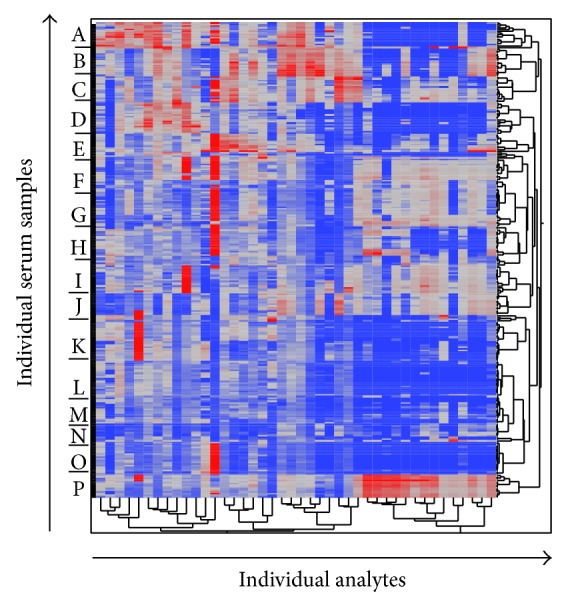
Figure 2.

Unsupervised hierarchical clustering of all data. Protein levels of peripheral blood cytokines and growth factors as determined by multiplex cytokine array were log-normalized and clustered. Each row represents an individual serum sample, and each analyte measured with the multiplex cytokine array is represented by a column. Even with log-transformation, all subjects' samples exhibited a strong tendency to cluster with other samples from the same subject, giving the impression of distinct subject-specific “bands” (labeled A–P) within the cluster.
