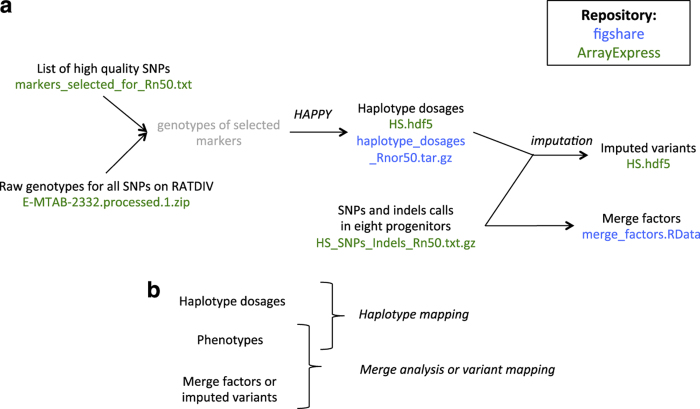
Figure 2. Generation and use of derived genetic data.
(a) This flow chart shows how the derived genetic data (haplotypes dosages, merge factors, imputed variants) were obtained from the raw data. The name of the file corresponding to each data item is shown, and coloured in green when it was submitted to ArrayExpress (Data Citation 1), and blue when it was submitted to figshare (Data Citation 2). (b) Data to combine for genetic mapping and merge analysis.

