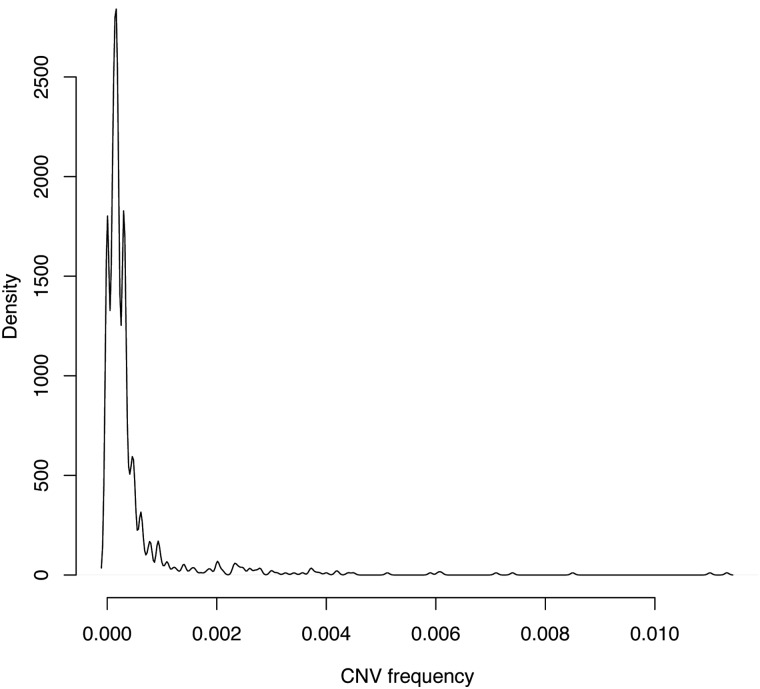
Figure 2.
Density distribution of CNVRs. Density plot for CNV frequency for CNVRs in cases and controls. Note that most (rare) CNVs detected occurred at a frequency of <0.1%. Even when the x-axis was extended to include CNPs up to 5% frequency (this figure stops at 1%), this right-skewed distribution continued to be extremely sparse in the right hand tail (Supplementary Material, Fig. S4). This graph is calculated per region, so a CNVR with one sample gets the same weighting in this figure as a CNVR containing 100 samples. Supplementary Material, Figure S4 shows histograms calculated per sample, which gives a more uniform distribution.

