Figure 3.
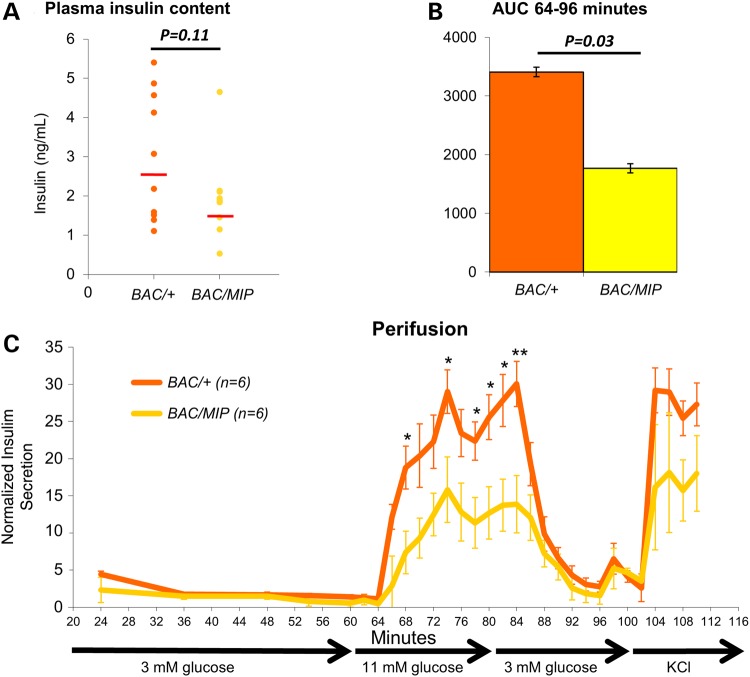
Beta cell analysis of insulin content and secretion. (A) Fasting plasma insulin levels in BAC/+ (orange) and BAC/MIP (yellow) mice after 10 weeks high fat diet (HFD). (B) AUC of insulin secretion measured by ELISA during insulin spike from 64 to 96 min of perifusion. (C) Normalized insulin levels secreted by isolated islets during glucose perifusion. Minutes indicate time since initial incubation of islets in glucose. Islets were incubated in varying glucose concentrations; 3 mm glucose from 0 to 60 min, 11 mm glucose from 60 to 80 min, 3 mm glucose from 80 to 100 min, and final incubation in KCl from 100 to 110 min. Insulin samples were collected every 12 min from 24 to 60 min and then every 2 min for the remainder. Insulin secretion from islets was quantified by insulin ELISA. *P < 0.05; **P < 0.01.

