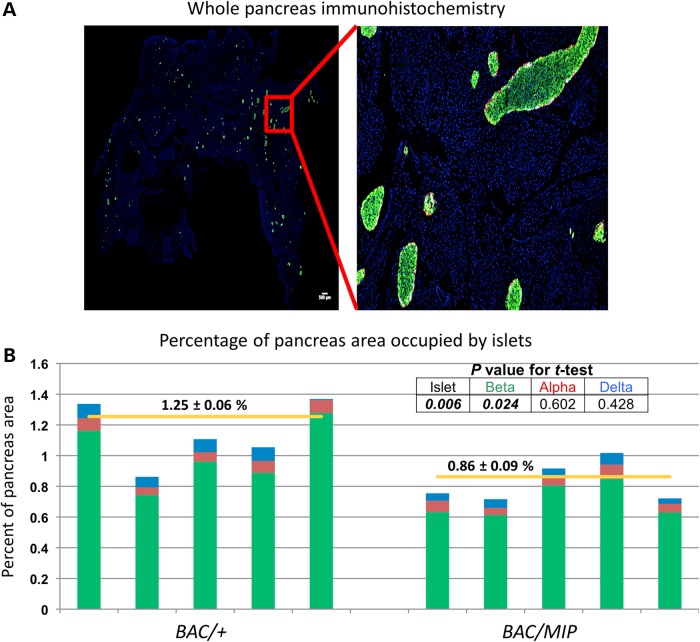
Figure 4.
Quantification of beta cell area. (A) Representative image of immunohistochemistry of whole-mouse pancreas with beta cells (green), alpha cells (red) and delta cells (white) and nuclei (blue). (B) Quantification of islet composition and area. The total endocrine cell area is normalized to the total pancreas area in each mouse; BAC/+ n = 5, BAC/MIP n = 5. Total islet area is then subdivided into its cellular components; beta cell area in green, alpha cell area in red, delta-cell area in blue. Yellow horizontal lines indicate the average total islet area for each group. BAC/+ and BAC/MIP mice are compared at total islet area as well as area of each cell type, with P values reported in table.

