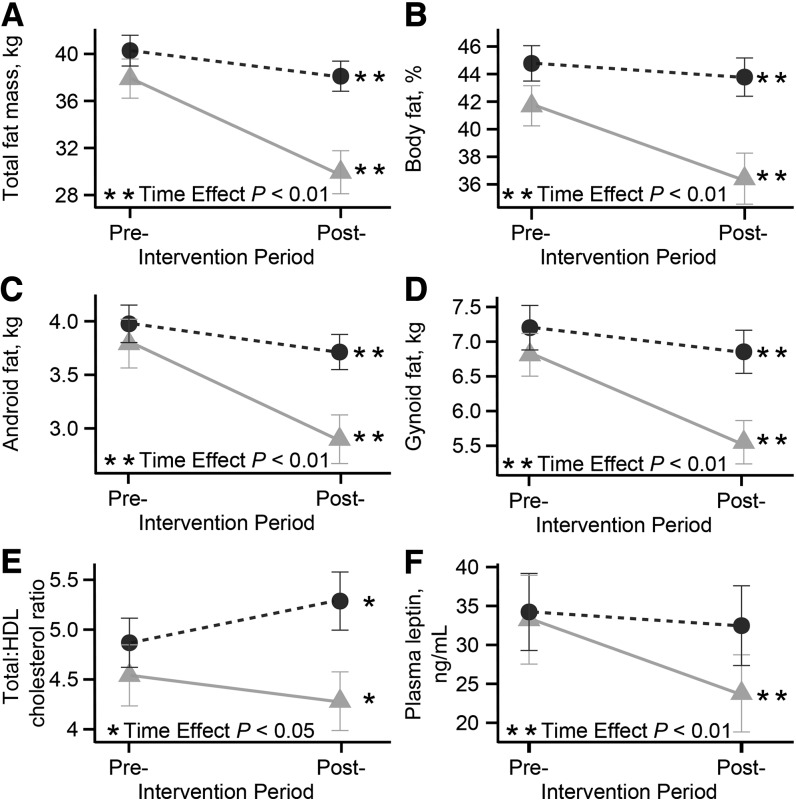
FIGURE 3.
Pre- and postintervention changes in selected clinical, adiposity, and endocrine indices including total fat mass (A), body fat (B), android fat (C), gynoid fat (D), total:HDL cholesterol ratio (E), and plasma leptin (F) in high- and low-weight–loss responders. Variables presented in the figure had a significant interaction term in linear mixed model analyses. High-responder (circles) and low-responder (triangles) represent high- and low-weight–loss tertiles, respectively. Serum cholesterol, HDL cholesterol, and leptin were measured after an overnight fast. Values are means ± SEMs, n = 22 for both groups. Post-, postintervention; Pre-, preintervention.

