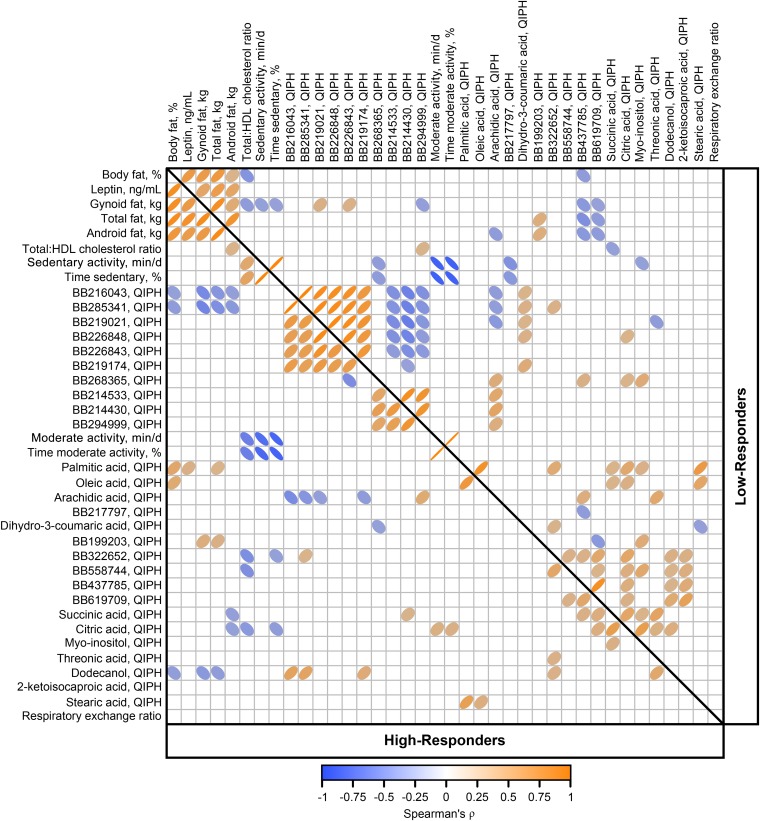
FIGURE 5.
Spearman correlation matrix of variables associated with weight-loss responsiveness in overweight and obese men and women (n = 67) consuming an energy deficit of 2092 kJ/d (500 kcal/d) for 12 wk. Variables were selected by partial least squares regression as discriminant of weight loss and found to be significantly different between high- and low-responders in linear mixed model analyses. High-responder and low-responder represent high- and low-weight–loss tertiles (n = 22 for both groups), respectively. Direction or color of ellipses represent positive or negative correlation, respectively. Darker color and thinner ellipses represent strength (Spearman’s ρ) of correlations. Only significant correlations at α = 0.05 are displayed. BB, BinBase identification numbers; QIPH, quantifier ion peak height.

