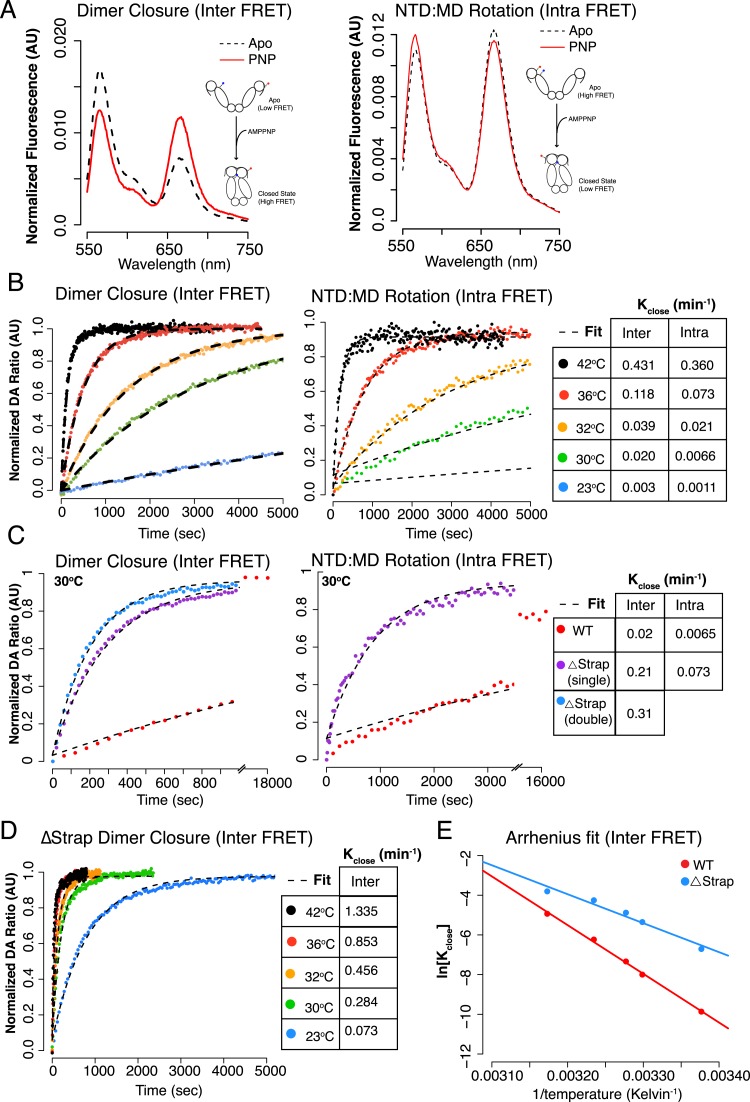
Figure 4. The NTD-strap regulates closure rate of TRAP1.
(A) Steady-state FRET scans at 23°C for apo and AMPPNP reactions after closure with AMPPNP reached completion illustrating the anti-correlated change in FRET upon closure as measured by ‘dimer closure’ between protomers (left, Inter FRET) and rotation of the NTD from apo to the closed state within one protomer ‘NTD:MD Rotation’ (right, Intra FRET). (B) Temperature-dependent closure rates for WT hTRAP1 measured by both the dimer closure and NTD rotation FRET probes from A. Closure rates are comparable between these two sets of FRET probes as indicated in the table to the right. The predicted increase in rate at higher temperatures is apparent. (C) Closure at 30°C of WT compared to heterodimers lacking one or both NTD strap residues measured by dimer closure FRET (left) and NTD rotation FRET (right). Closure rates are found in the table for each experiment. (D) Temperature-dependent closure rates of Δstrap protein measured using the dimer closure probes from A (Inter FRET) illustrating both a rate acceleration and a dramatic loss of temperature dependence compared to WT (B, left panel). (E) Arrhenius plot of WT and Δstrap plotted using data from panels (B) (left) and (D). From the difference in activation energies Ea between WT and Δstrap, the strap contributes approximately 60% of the measured Ea for WT hTRAP1 (48.8 kcal/mol Ea for WT; 29 kcal/mol Δstrap). These data are consistent with the steady-state SAXS and ATPase and show that removal of the strap region lowers the energy barrier between apo and the closed state.


