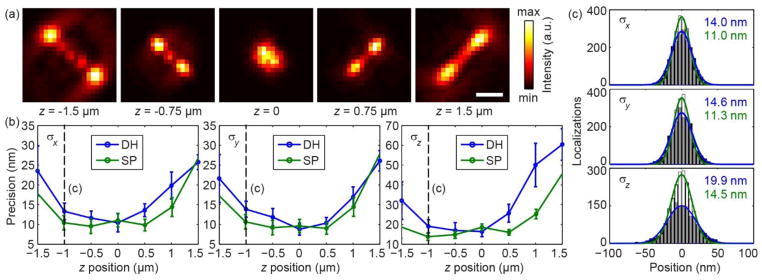
FIG 3.

(Color online): (a) Experimental realizations of the Saddle-Point (SP) PSF for various z positions (stated). Scale bar: 1 μm (in sample space). Images were re-scaled to min/max intensity on an individual basis. (b) Experimental measurements of statistical localization precisions as the standard deviations σx, σy, σz of localization outcomes from 500 camera frames. Bars show standard deviations derived from n = 4 independent experiments. (c) Experimental histograms of localization outcomes along the x, y and z dimensions, recorded at z = −1 μm (dotted lines in (b), data from 4 measurements). Extracted σx, σy, σz are stated.
