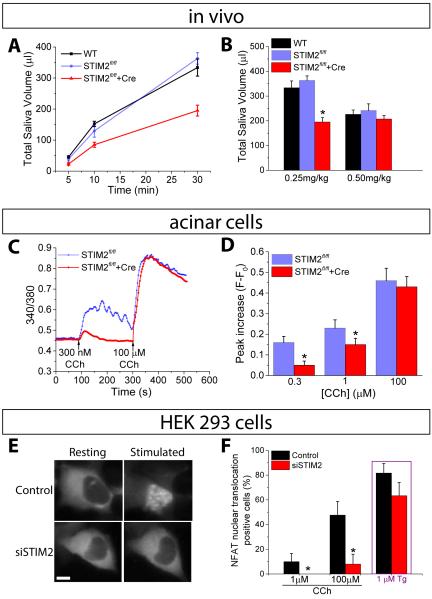
FIGURE 1. Targeted knockout of STIM2 in mouse salivary glands.
(A) Saliva secretion following stimulation with pilocarpine (0.25 mg/kg body weight) in wild-type (WT), STIM2fl/fl, and STIM2fl/fl+Cre mice. (B) Bar graph showing total saliva collected after 30 min with the indicated amounts of pilocarpine [*P< 0.05, N = 9 or more mice per group; ANOVA was used to compare the saliva volume for STIM2fl/fl, and STIM2fl/fl+Cre mice with the WT mice]. (C and D) Representative traces showing changes in fura2 fluorescence following CCh stimulation of dispersed salivary gland acinar cells. Data are representative of 3 or more independent cell preparations, with 15-25 acini imaged per experiment. Each cell preparation used salivary glands from one mouse. (D) Peak increase in fura2 fluorescence (F - F0), calculated using data from three different cell preparations [at each [CCh] [*P< 0.05, N = 72-77 cells from 3 different preparations; compared to the respective value for STIM2fl/fl using Student’s t-test]. (E) Nuclear translocation of GFP-NFAT in control and siSTIM2-treated HEK293 cells, following stimulation with CCh or Tg. The images shown are representative of results obtained with 30-40 cells per experiments from 3 independent experiments. (F) Proportion (%) of cells showing nuclear translocation of GFP-NFAT at 25 min after the addition of the indicated concentrations of CCh or 10 min after the addition of 1 µM Tg [*P< 0.05, N = 100-110 cells per group from 3 separate experiments; chi-square test was used to compare nuclear translocation of GFP-NFAT between control and siSTIM2 cells at each stimulation.

