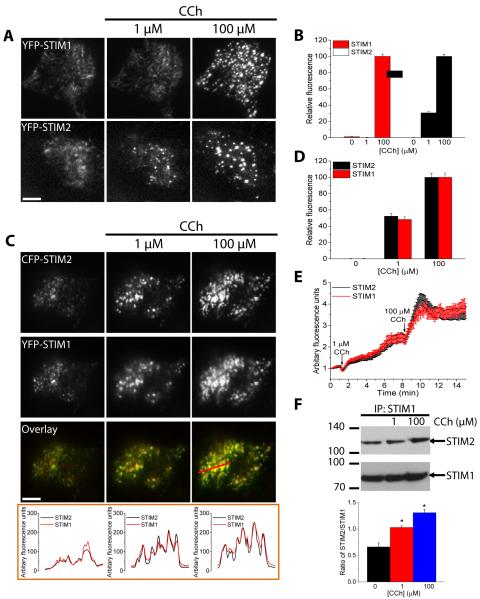
FIGURE 3. Clustering of STIM1 and STIM2 in response to relatively low and high levels of stimulation.
Fluorescent tagged proteins were expressed, individually or together, in HEK293 cells. Cells were stimulated with the indicated concentrations of CCh and TIRF microscopy was used to image the fluorescence and visualize puncta in ER-PM junctions. The bar in this and subsequent figures indicates a scale of 10 μm. (A) Pattern of YFP-STIM1 (upper) and YFP-STIM2 (lower) fluorescence in cells individually expressing each construct sequentially stimulated with 1 and 100 µM CCh. (B) Bar graph showing representative changes in puncta fluorescence intensity for YFP-STIM1 and YFP-STIM2 at each [CCh], relative to the fluorescence at 100 µM CCh for each protein. A region of interest (ROI) was drawn around each puncta to quantify the changes in the fluorescence of individual puncta following each stimulation [N = 15-20 ROIs from each cell with 4-6 cells analyzed per experiment and with 3 or more separate experiments performed]. (C) Pattern of CFP-STIM2 (upper) and YFP-STIM1 (middle) fluorescence and the merged fluorescence (overlay in lower) in a cell co-expressing both proteins sequentially stimulated with 1 and 100 µM CCh. The graphs below the images show linescan measurements with the linescan region indicated in the rightmost image. (D) Bar graph showing relative increase in puncta fluorescence intensity for YFP-STIM1 and CFP-STIM2 following each stimulation in cells co-expressing both proteins [data are from 3 cells (average of 15-20 ROIs per cell) and is representative of 10-15 cells from 3 or more separate experiments performed]. (E) The time-dependent increase in co-expressed YFP-STIM1 and CFP-STIM2 fluorescence following stimulation with 1 and 100 µM CCh [ROIs and number of cells and experiments as described in (D)]. (F) Coimmunoprecipitation of endogenous STIM2 with endogenous STIM1 following stimulation with 1 and 100 µM CCh. The bar graph below the blot shows the abundance of STIM2 relative to STIM1 in the immunoprecipitates at each [CCh] [*P<0.05, N = 3 or more separate experiments; ANOVA with Sidak’s multiple comparisons test].

