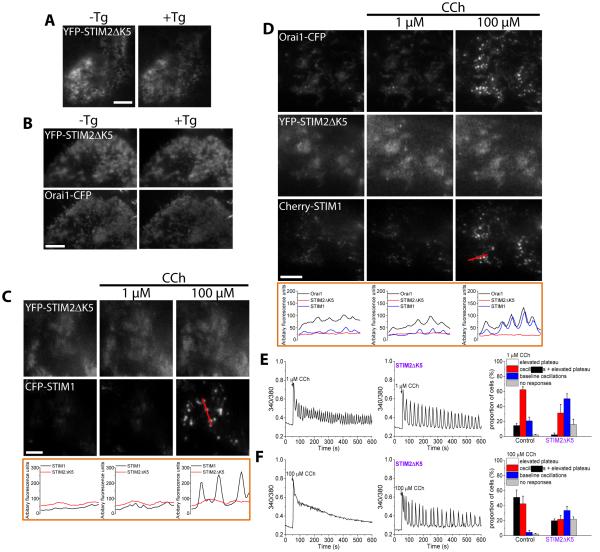
FIGURE 5. Effect of the STIM2ΔK5 mutant on CCh-induced STIM1 and Orai1 clustering and SOCE.
Fluorescent tagged proteins were expressed, individually or together, in HEK293 cells that were stimulated with the indicated concentrations of CCh. TIRF microscopy was used to image the fluorescence and visualize puncta in ER-PM junctions. (A) Fluorescence of cells expressing YFP-STIM2ΔK5 alone in the presence or absence of thapsigargin (Tg, 1 µM for 5 min) to deplete ER Ca2+ stores. (B) Fluorescence of cells co-expressing YFP-STIM2ΔK5 and Orai1-CFP in the presence or absence of thapsigargin (Tg, 1 µM for 5 min). (C) Fluorescence of cells co-expressing YFP-STIM2ΔK5 and CFP-STIM1 following sequential stimulation with the indicated concentrations of CCh. The linescans are shown immediately below each image for each [CCh] (the linescan region is indicated in the rightmost panel). (D) Fluorescence of HEK293 cells co-expressing YFP-STIM2ΔK5, Cherry-STIM1, and Orai1-CFP following sequential stimulation with the indicated concentrations of CCh. The line scans are shown immediately below each image for each [CCh] (the linescan region is indicated in the rightmost panel). Images are representative of results obtained in 15-20 cells from at least 4 independent experiments. (E and F) Fluorescence traces representing Ca2+ responses exhibited by the majority of control cells (left) and HEK293 cells expressing STIM2ΔK5 (right) following stimulation with 1 (E) and 100 (F) µM CCh. Bar graphs show the percentage (%) of cells showing a given pattern of Ca2+responses at each concentration of CCh. Overall pattern of responses in the two groups was significantly different [*P<0.05, N = 170-240 cells per group from 3-5 separate experiments; chi-square test].

