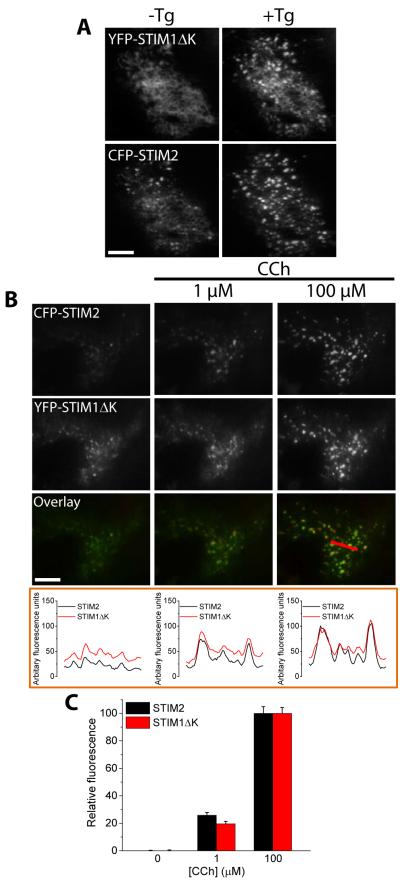
FIGURE 6. Effect of the STIM1ΔK mutant on CCh-induced STIM2 clustering.
Fluorescent tagged proteins were expressed, individually or together, in HEK293 cells and TIRF microscopy was used to image the fluorescence and visualize puncta in ER-PM junctions. (A) Fluorescence of cells expressing YFP-STIM1ΔK and CFP-STIM2 in the presence or absence of thapsigargin (Tg, 1 µM for 5 min) to deplete ER Ca2+ stores. (B) Fluorescence of cells co-expressing YFP-STIM1ΔK and CFP-STIM2 following sequential stimulation with the indicated concentrations of CCh. The merged fluorescence (overlay) of all proteins is shown in the upper panels, with the linescans immediately below each image for each [CCh] (the linescan region is indicated in the rightmost panel). (C) The bar graph shows the changes in puncta fluorescence intensity for YFP-STIM1ΔK and CFP-STIM2 following each stimulation in cells co-expressing both proteins, relative to the intensity at 100 µM CCh. ROI was drawn around each puncta to quantify the changes in the fluorescence of individual proteins within the puncta following each stimulation [N = 15-20 ROIs from each cell with 2-4 cells analyzed per experiment and with 3 or more separate experiments performed].

