. 2014 Nov 21;3:e03881. doi: 10.7554/eLife.03881

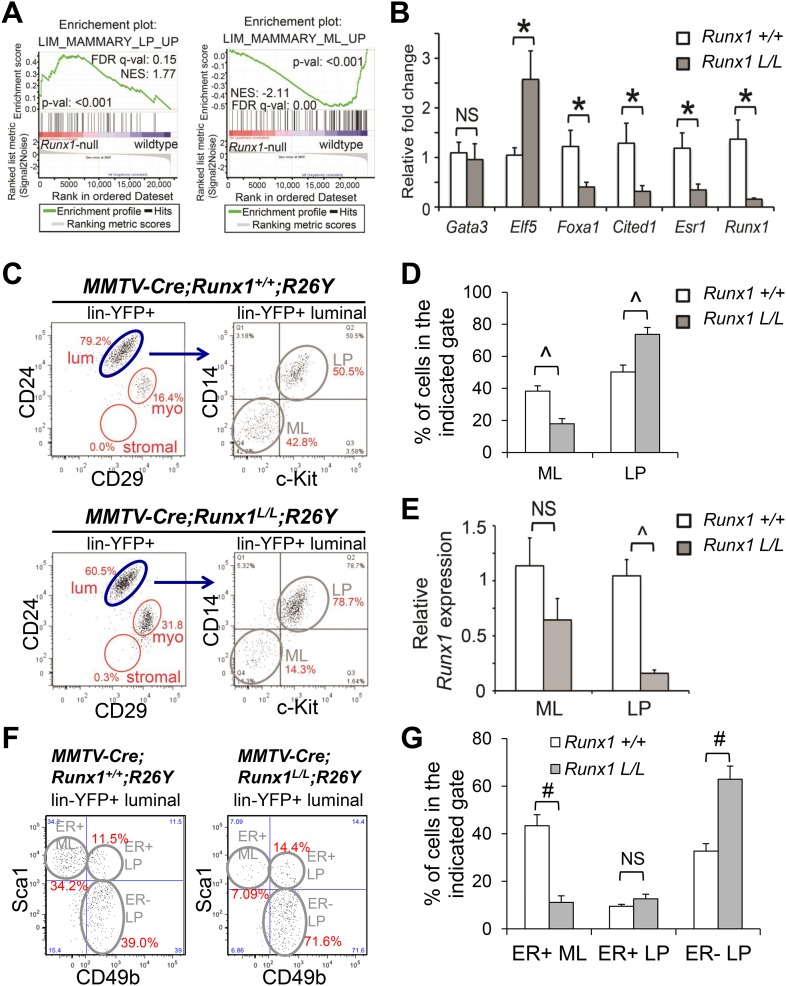
Figure 4. Runx1 disruption leads to a profound reduction in ER+ MLs.

(A) GSEA enrichment plots showing correlation of the expression profiles of Runx1-null or WT luminal MECs with previously published conserved human and mouse signatures of LPs (left) or MLs (right) (Lim et al., 2010). (B) qRT-PCR validation of TF/co-factor genes known to play roles in luminal lineage specification and maintenance. RNA was isolated from YFP+ Runx1-null and WT primary luminal MECs. (C) FACS plots of expression of CD14 and c-Kit, two LP markers (Asselin-Labat et al., 2011), in the gated YFP+ luminal MECs (LinCD24+CD29lo) of adult MMTV-Cre;Runx1L/L;R26Y virgin females and MMTV-Cre;Runx1+/+;R26Y control females. Note the CD14c-Kit mature luminal (ML) subpopulation was largely lacking in the lower right plot. (D) Quantification of the percentages of the ML and LP subpopulations as indicated in C, showing significant reduction in the ML subpopulation in MMTV-Cre;Runx1L/L;R26Y females (n = 13) compared to that in MMTV-Cre;Runx1+/+;R26Y control females (n = 10). (E) qRT-PCR analysis showing significantly reduced Runx1 expression in the LP subpopulation but not in the ML subpopulation in MMTV-Cre;Runx1L/L;R26Y females. (F) FACS plots of expression of CD49b, a LP marker, and Sca1, an ER+ ML marker (Shehata et al., 2012) in the gated YFP+ luminal MEC population. Note the CD49bSca1+ ER+ ML subpopulation was dramatically reduced, whereas the CD49b+Sca1 ER LP subpopulation was increased in MMTV-Cre;Runx1L/L;R26Y females. (G) Quantification of the percentages of the ER+ ML, ER+ LP, and ER LP subpopulations as indicated in F, showing significant reduction in the ER+ ML subpopulation in MMTV-Cre;Runx1L/L;R26Y females (n = 4) compared to those in MMTV-Cre;Runx1+/+;R26Y control females (n = 4). p values: *: p ≤ 0.05; #: p ≤ 0.005; ^: p ≤ 0.0005; NS = not significant; error bars represent mean ± S.E.M.

DOI: http://dx.doi.org/10.7554/eLife.03881.008

Figure 4—source data 1. (A) Gene sets from the MSigDB database C2-CGP (chemical and genetic perturbations, v3.1) enriched in Runx1-null luminal cells.
(B) Gene sets from the MSigDB database C2-CGP (chemical and genetic perturbations, v3.1) enriched in Runx1-WT luminal cells. (C) Gene sets from the MSigDB database C2-CP:KEGG (KEGG gene sets, v3.1) enriched in Runx1-null luminal cells.
elife03881s001.xlsx (338.2KB, xlsx)
DOI: 10.7554/eLife.03881.009

Figure 4.

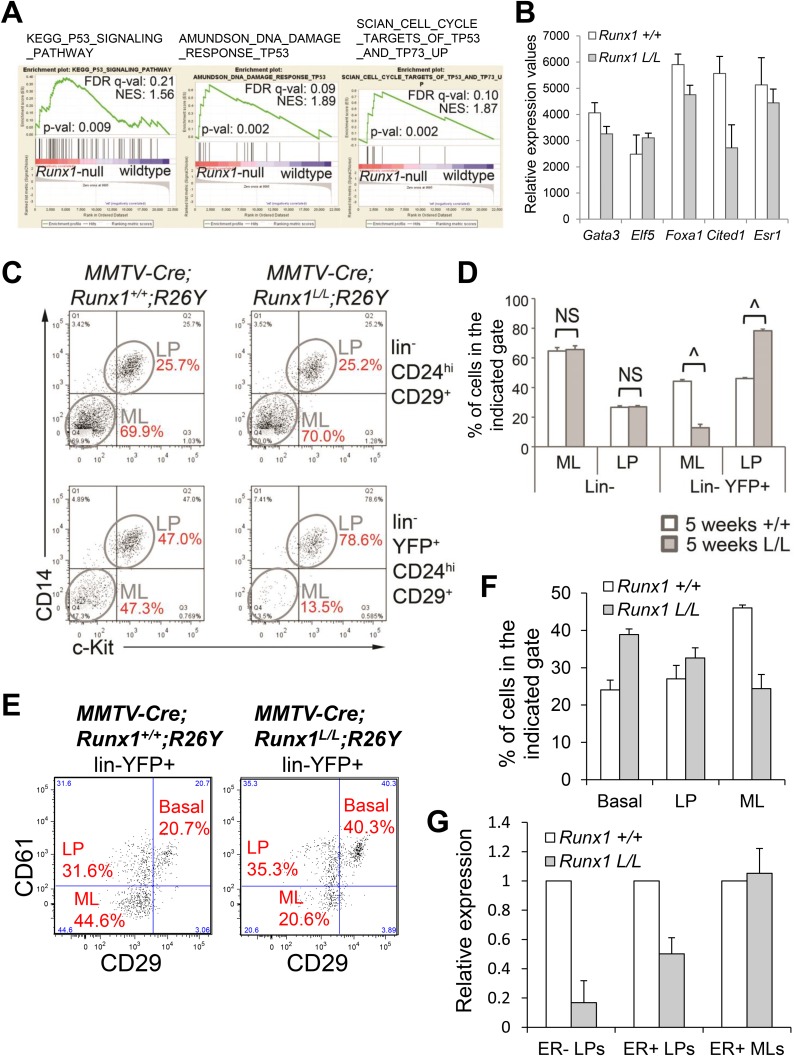
Figure 4—figure supplement 1. Analysis of the luminal phenotype in MMTV-Cre;Runx1L/L;R26Y females.

Figure 4—figure supplement 1.

(A) GSEA analysis of Runx1-null and WT luminal MECs showing enrichment of several gene sets related to the p53 signaling pathway in Runx1-null luminal MECs compared to WT luminal MECs. (B) Relative expression values of the indicated genes determined by microarray analysis of Runx1-null (Runx1 L/L) and WT (Runx1 +/+) luminal MECs. Affymetrix probes used to estimate expression of each indicated gene are 1448886_at, 1419555_at, 1418496_at, 1449031_at, and 1460591_at for Gata3, Elf5, Foxa1, Cited1, and Esr1, respectively. (C) FACS plots of CD14 and c-Kit expression in the lin luminal (upper plots) and linYFP+ luminal (bottom plots) MECs of 5-week old MMTV-Cre;Runx1+/+;R26Y and MMTV-Cre;Runx1L/L;R26Y females showing reduced CD14c-Kit ML subpopulation within the linYFP+ luminal population in MMTV-Cre;Runx1L/L;R26Y female (bottom right plot). (D) Quantifications (for C) of the percentages of ML or LP subpopulations within the indicated gates showing significantly reduced ML and increased LP subpopulations within the linYFP+ luminal gate in 5-week old MMTV-Cre;Runx1L/L;R26Y females (n = 4) (L/L) compared to those in 5-week old MMTV-Cre;Runx1+/+;R26Y control females (n = 4) (+/+). (E) FACS plots showing the reduced YFP-marked linCD29loCD61 ML subpopulation in adult MMTV-Cre;Runx1L/L;R26Y virgin females (n = 2) compared to MMTV-Cre;Runx1+/+;R26Y control females (n = 3). (F) Quantifications for the basal, LP and ML subpopulations based on CD61 and CD29 staining in E. (G) qRT-PCR analysis showing significantly reduced Runx1 expression in the ER LP subpopulation, partial Runx1 reduction in the ER+ LP subpopulation, and no reduction in the ER+ ML subpopulation from MMTV-Cre;Runx1L/L;R26Y (Runx1 L/L) females, based on CD49b and Sca1 staining, compared to those from MMTV-Cre;Runx1+/+;R26Y (Runx1 +/+) control females. p values: ^: p ≤ 0.0005; NS = not significant; error bars represent mean ± S.E.M.