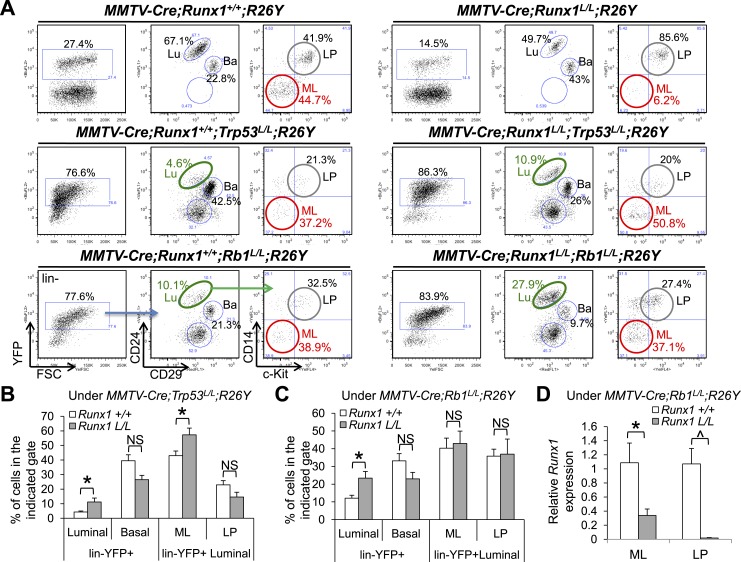
Figure 5. Reduction in ER+ MLs upon Runx1 disruption can be rescued by Trp53 or Rb1 loss.
(A) FACS analysis showing total lin−YFP+ MEC population, lin−YFP+ luminal population, and lin−YFP+ ML and LP subpopulations (from left to right for each genotype, an example of the gating strategy is indicated in the bottom left plots) in female mice with the indicated genotypes. Those highlighted in green show increased lin−YFP+ luminal populations upon the loss of both Runx1 and Trp53 or Rb1 (middle and bottom right plots, respectively) compared to those of Trp53 or Rb1 loss alone (middle and bottom left plots, respectively); those highlighted in red show increased lin−YFP+ ML subpopulations upon the loss of both Runx1 and Trp53 or Rb1 (middle and bottom right plots, respectively) compared to that of Runx1-loss alone (upper right plot). Lu: luminal; Ba: basal; LP: luminal progenitor; ML: mature luminal cell. (B–C) Quantifications for the percentages of each indicated subpopulation in A under either the Trp53-loss (B) or Rb1-loss background (C); in (B) Trp53-loss alone (n = 5), Trp53/Runx1-loss (n = 3); in (C) Rb1-loss alone (n = 5), Rb1/Runx1-loss (n = 5). (D) qRT-PCR analysis showing significantly reduced Runx1 expression in both the YFP-marked ML and LP subpopulations in MMTV-Cre;Runx1L/L;Rb1L/L;R26Y females. p values: *: p ≤ 0.05; ^: p ≤ 0.0005; NS = not significant; error bars represent mean ± S.E.M.


