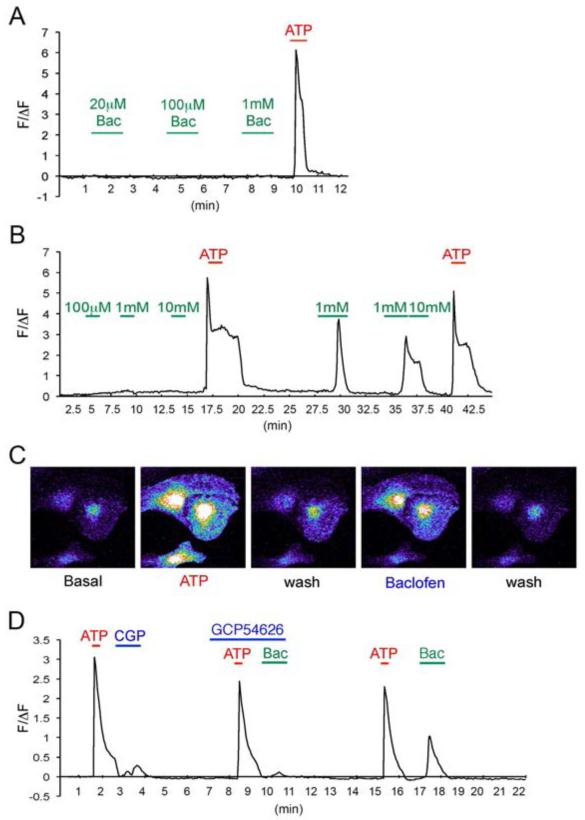
Fig. 2.
Calcium imaging in cultured astrocytes. A. Time course of Ca2+ fluorescence changes (ΔF/F0) by baclofen before and after ATP (100 μM) treatments. Data points are averages of 7 cells in the imaging field in one experiment. The horizontal bar represents the application of stimuli. Green: baclofen, Red: 100 μM ATP. B. An example of images of cultured cortical astrocytes loaded with the Fluo-4/AM. Cells were stimulated with 100 μM ATP for 15 sec, washed until the calcium levels are reduced to baseline, then stimulated again with 100 μM baclofen for 1 min. C. Representative Ca2+ fluorescence changes (ΔF/F0) of baclofen-induced calcium increase with/without GABABR antagonist CGP54626 (1 μM). Data points are averages of 6 cells in the imaging field in one experiment. The horizontal bar represents the application of stimuli. Green: 100 μM baclofen (Bac), Red: 100 μM ATP, Blue: 1 μM CGP54626.

