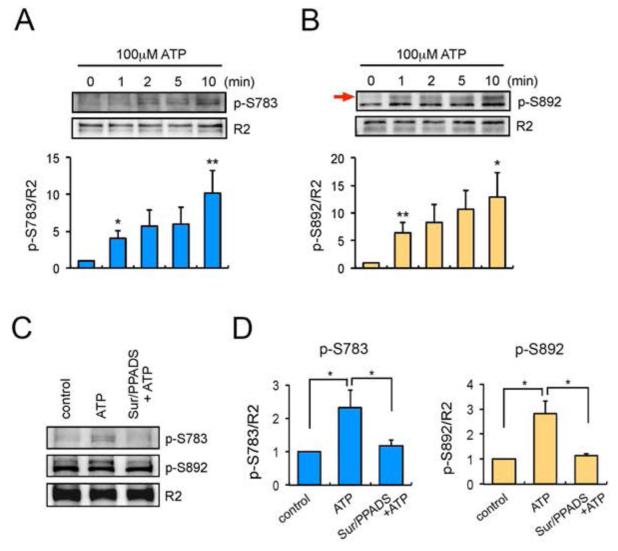
Fig. 4.
ATP stimulation increases phosphorylation of GABABRs. A and B. Cortical astrocytes were treated with 100 μM ATP for 0-10 min. Total lysates were subjected to SDS-PAGE and visualised by immunoblotting with anti-p-S783 antibodies (A), anti-p-S892 antibodies (B) or GABABR2 antibodies. Integrated intensities were calculated by densitometry measurements of immunoblots in Image J and were normalised to averages of R2 subunits. Bar graphs are shown as a change relative to control (0 min) and represent mean value ± SEM of 3 independent experiments. *p<0.05, **p<0.01, one-way ANOVA. The black arrow on panel B is pointing the band representing p-S892. C. Cortical astrocytes were treated with P2 purinoceptor antagonists Suramin (300 μM) and PPADS (100 μM) for 15 min prior to ATP (100 μM) stimulation. ATP was then applied for 10 min and the phosphorylation of S783 (p-S783) and S892 (p-S892) were visualised by immunoblotting. D. Normalised quantification of p-S783 (left) and p-S893 (right). Data are shown as a change relative to control and represent mean ± SEM of 5 independent experiments for p-S783 and 3 independent experiments for p-S892. *p<0.05, one-way ANOVA.

