
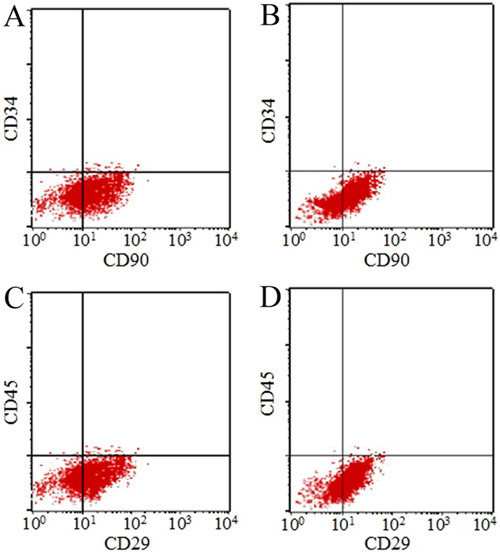
Figure 2. Immune-phenotypic analysis through flow cytometry detection. A, C, myelodysplastic syndromes (MDS) group; B, D, normal control group.
Official websites use .gov
A
.gov website belongs to an official
government organization in the United States.
Secure .gov websites use HTTPS
A lock (
) or https:// means you've safely
connected to the .gov website. Share sensitive
information only on official, secure websites.