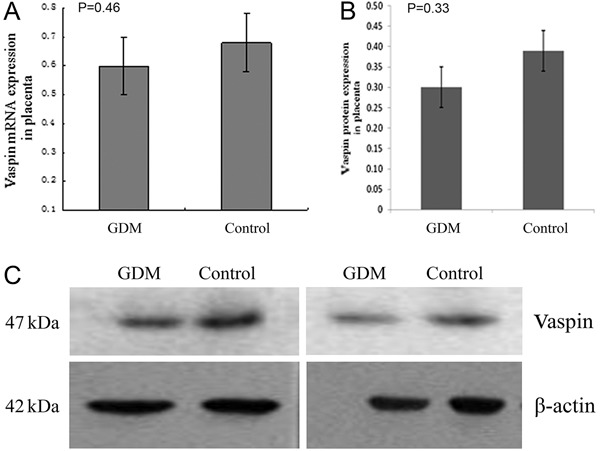
Figure 2. Real-time RT-qPCR and Western blotting were performed on gestational diabetes mellitus (GDM) and normal glucose tolerance (NGT) term placentas. A, Quantification of differences in vaspin mRNA expression between the two groups; B and C, quantification of differences in vaspin protein expression between the two groups. β-actin served as an internal control. One-way ANOVA was used for statistical analysis.

