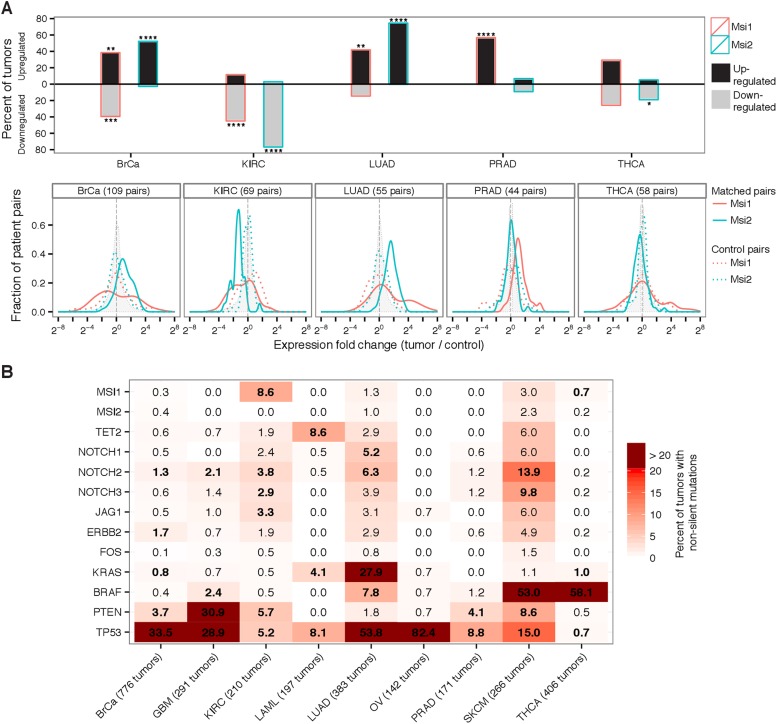
Figure 1. Msi genes are frequently overexpressed in breast, lung, and prostate cancer but downregulated in kidney cancer.
(A) Top: percentage of matched tumor–control pairs with upregulated (black-fill bars) or downregulated (grey-fill bars) Msi1 or Msi2 in five cancer types with matched RNA-Seq data. Upregulated/downregulated defined as at least two-fold change in expression in tumor relative to matched control. Asterisks indicate one-tailed statistical significance levels relative to control pairs. Bottom: distribution of fold changes for Msi1 and Msi2 in matched tumor–control pairs (solid red and green lines, respectively) and in an equal number of control pairs (dotted red and green lines, respectively.) Shaded gray density shows the fold change across all genes. (B) Percentage of tumors with non-silent mutations in Msi1/Msi2 and a select set of oncogenes and tumor suppressors across nine cancer types. Bold entries indicate genes whose mutation rate is at least two-fold above the cancer type average mutation rate.


